Writing
How to Enrich RUM Data in Datadog
Learn how to use the PerformanceObserver API to capture custom performance metrics and send them to Datadog RUM for better visibility into your application's behavior.

By default, Datadog logs many useful details from the browser. However, sometimes you need more - especially if you don’t have proper logging on the server side.
If you ever developed some complex dashboards in corporate environment, you are probably familiar with big data tables. Sometimes, it takes a long time to display information in these tables and depending on your parameters or filtering options, responses from your APIs can vary.
Most likely your ‘data table’ will be the most important element in your page. But it will not be picked by LCP (Largest Contentful Paint). Also, your business owners might be interested to know how long it takes to display that data to your users.
So how can we measure this?
Datadog already knows how long each request takes in the browser, but it can not see the content of those requests, or how you make those requests. For example, it can not know if your user is requesting 10 rows at a time or 50.
Using the PerformanceObserver API
We will use Performance observer to get request timing data. This API is used by many RUM tools under the hood, and it only provides performance related information. It can not access response body details, which is by design (and good for security reasons).
You may want to build a correlation between your response size and response duration, then visualize it. That’s exactly what we will do here.
Example App
Let’s have an example web page. This UI displays Nasdaq stock information via a table. This page has 4 key elements:
- An
<h1>element (NASDAQ Stocks Dashboard) - A table
- A “rows per page” button (to decide how much data to fetch)
- Paginator buttons (to trigger new fetches)
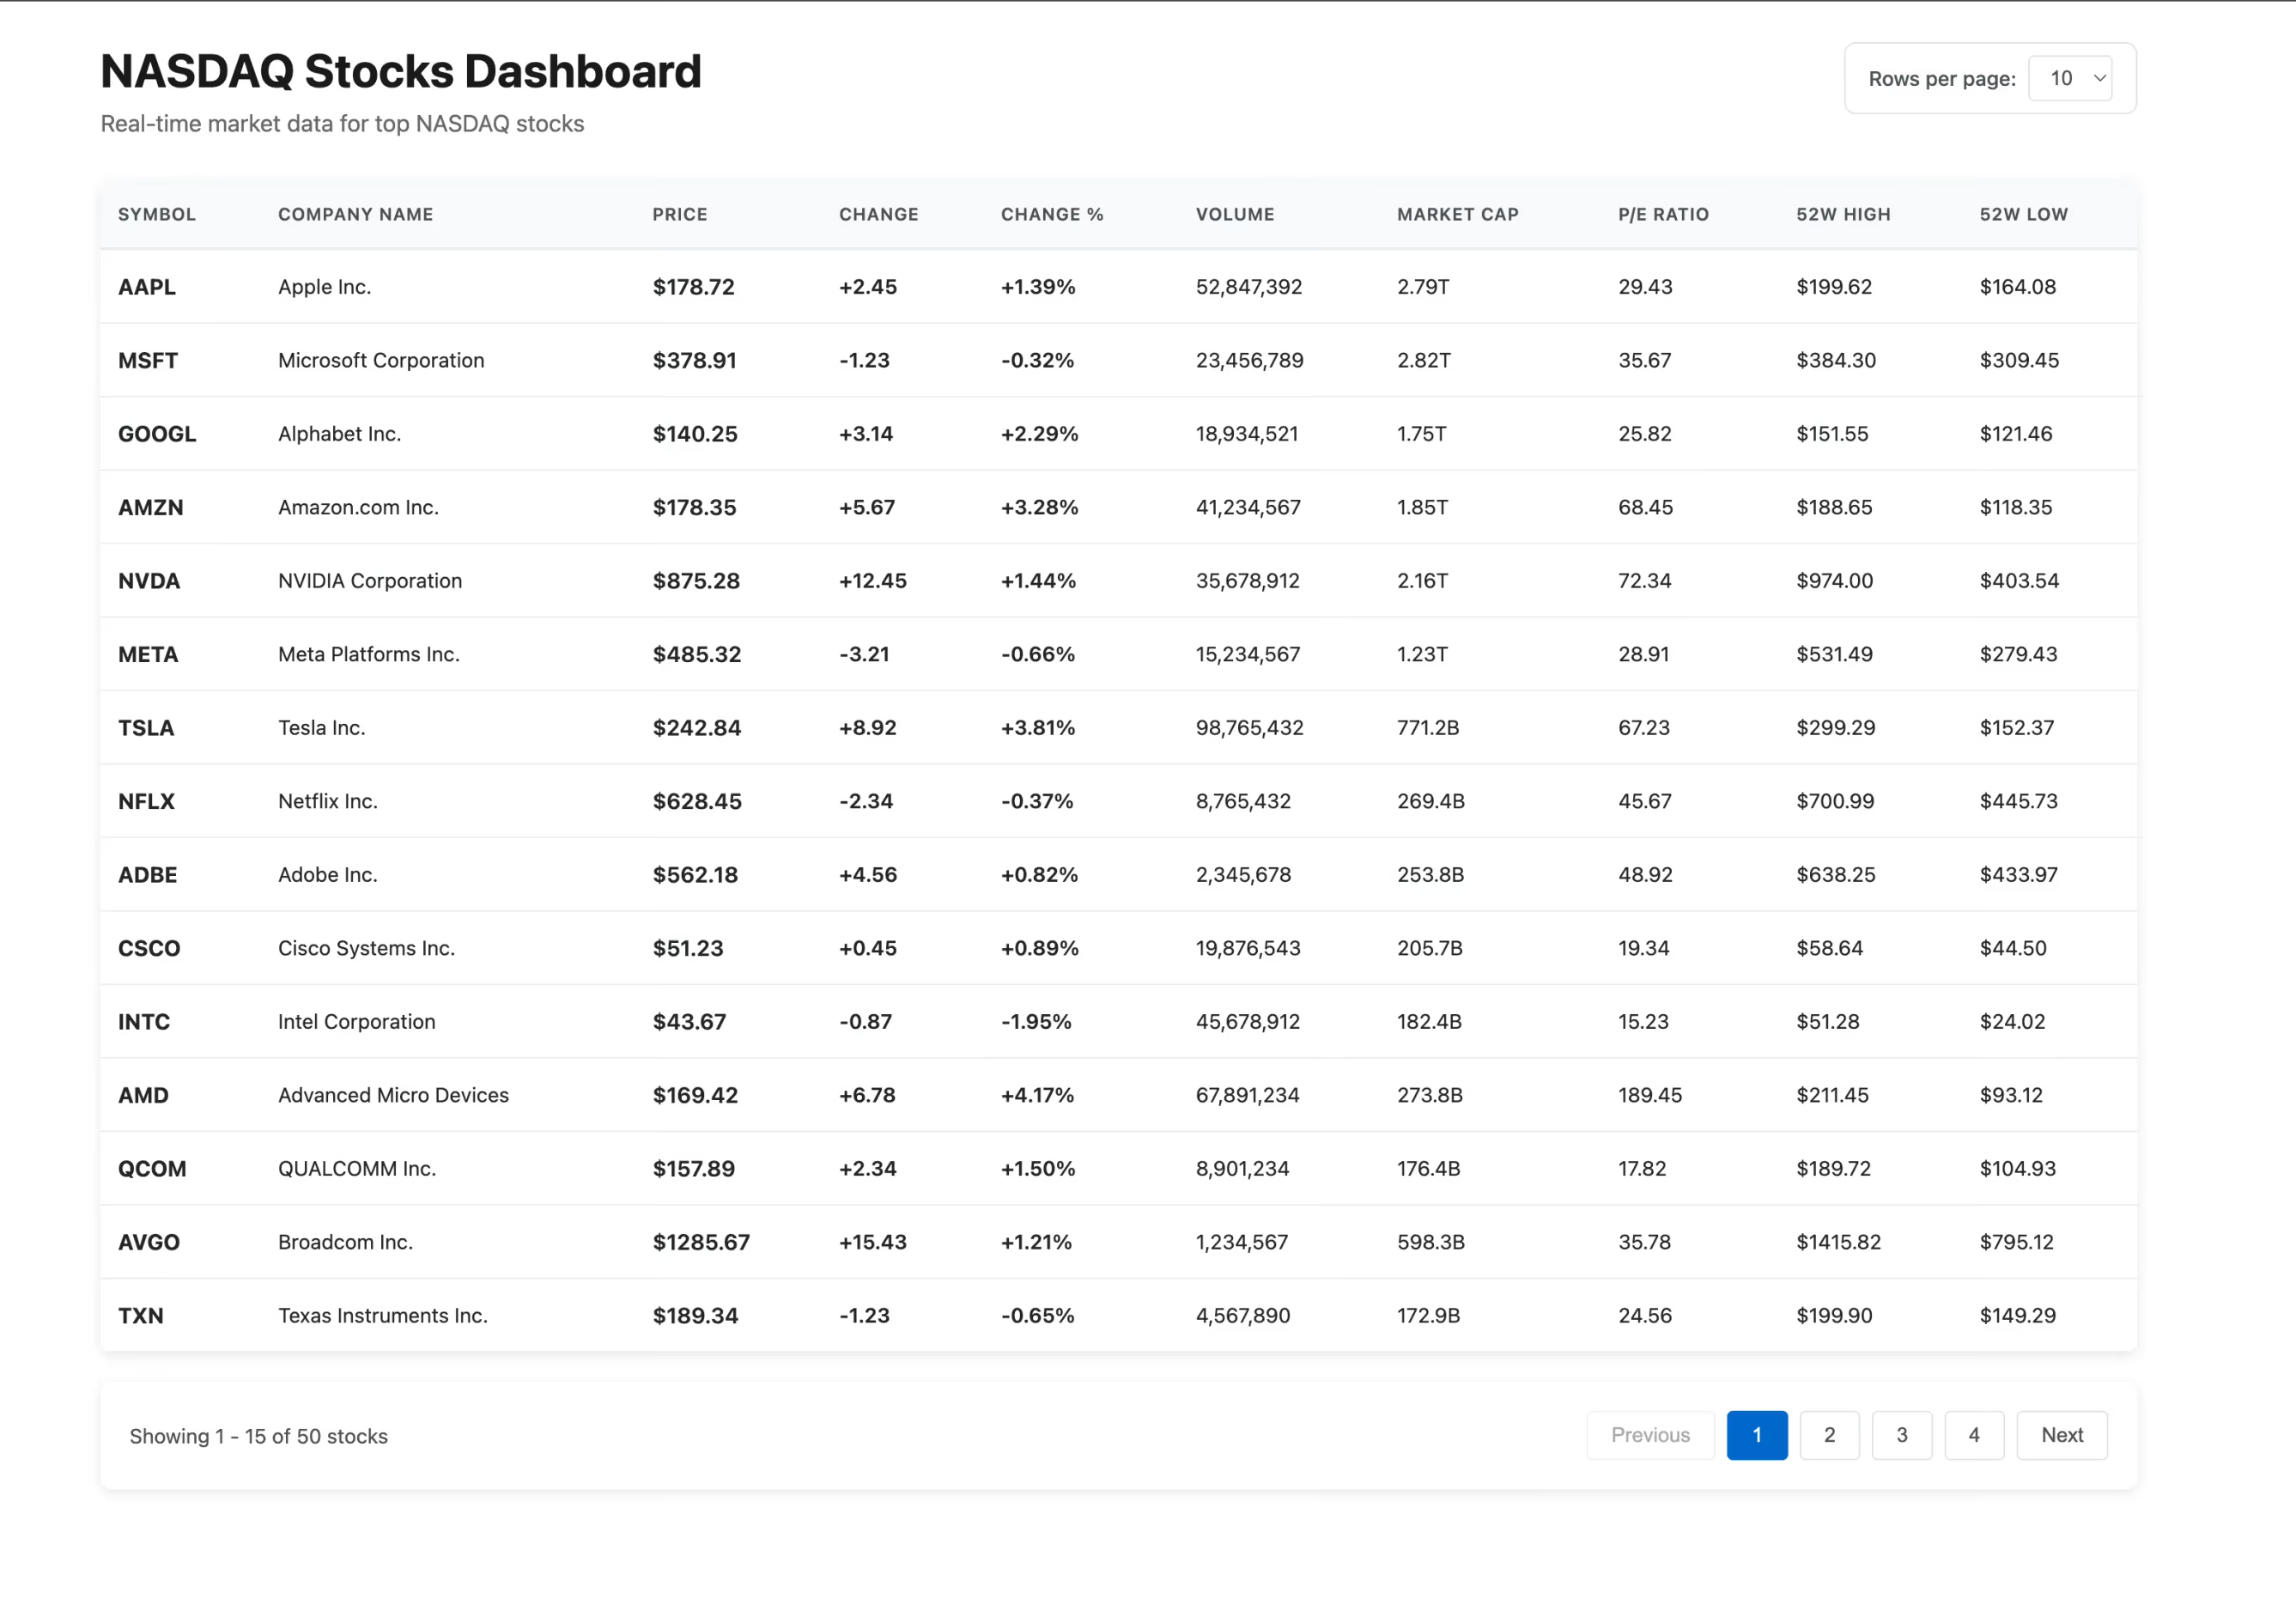
If we go to the performance tab in DevTools, we will notice the <h1> tag will be picked as our LCP element. In your Datadog UI you will see timing for this element, so having a good LCP score here doesn’t mean your table is rendering fast!
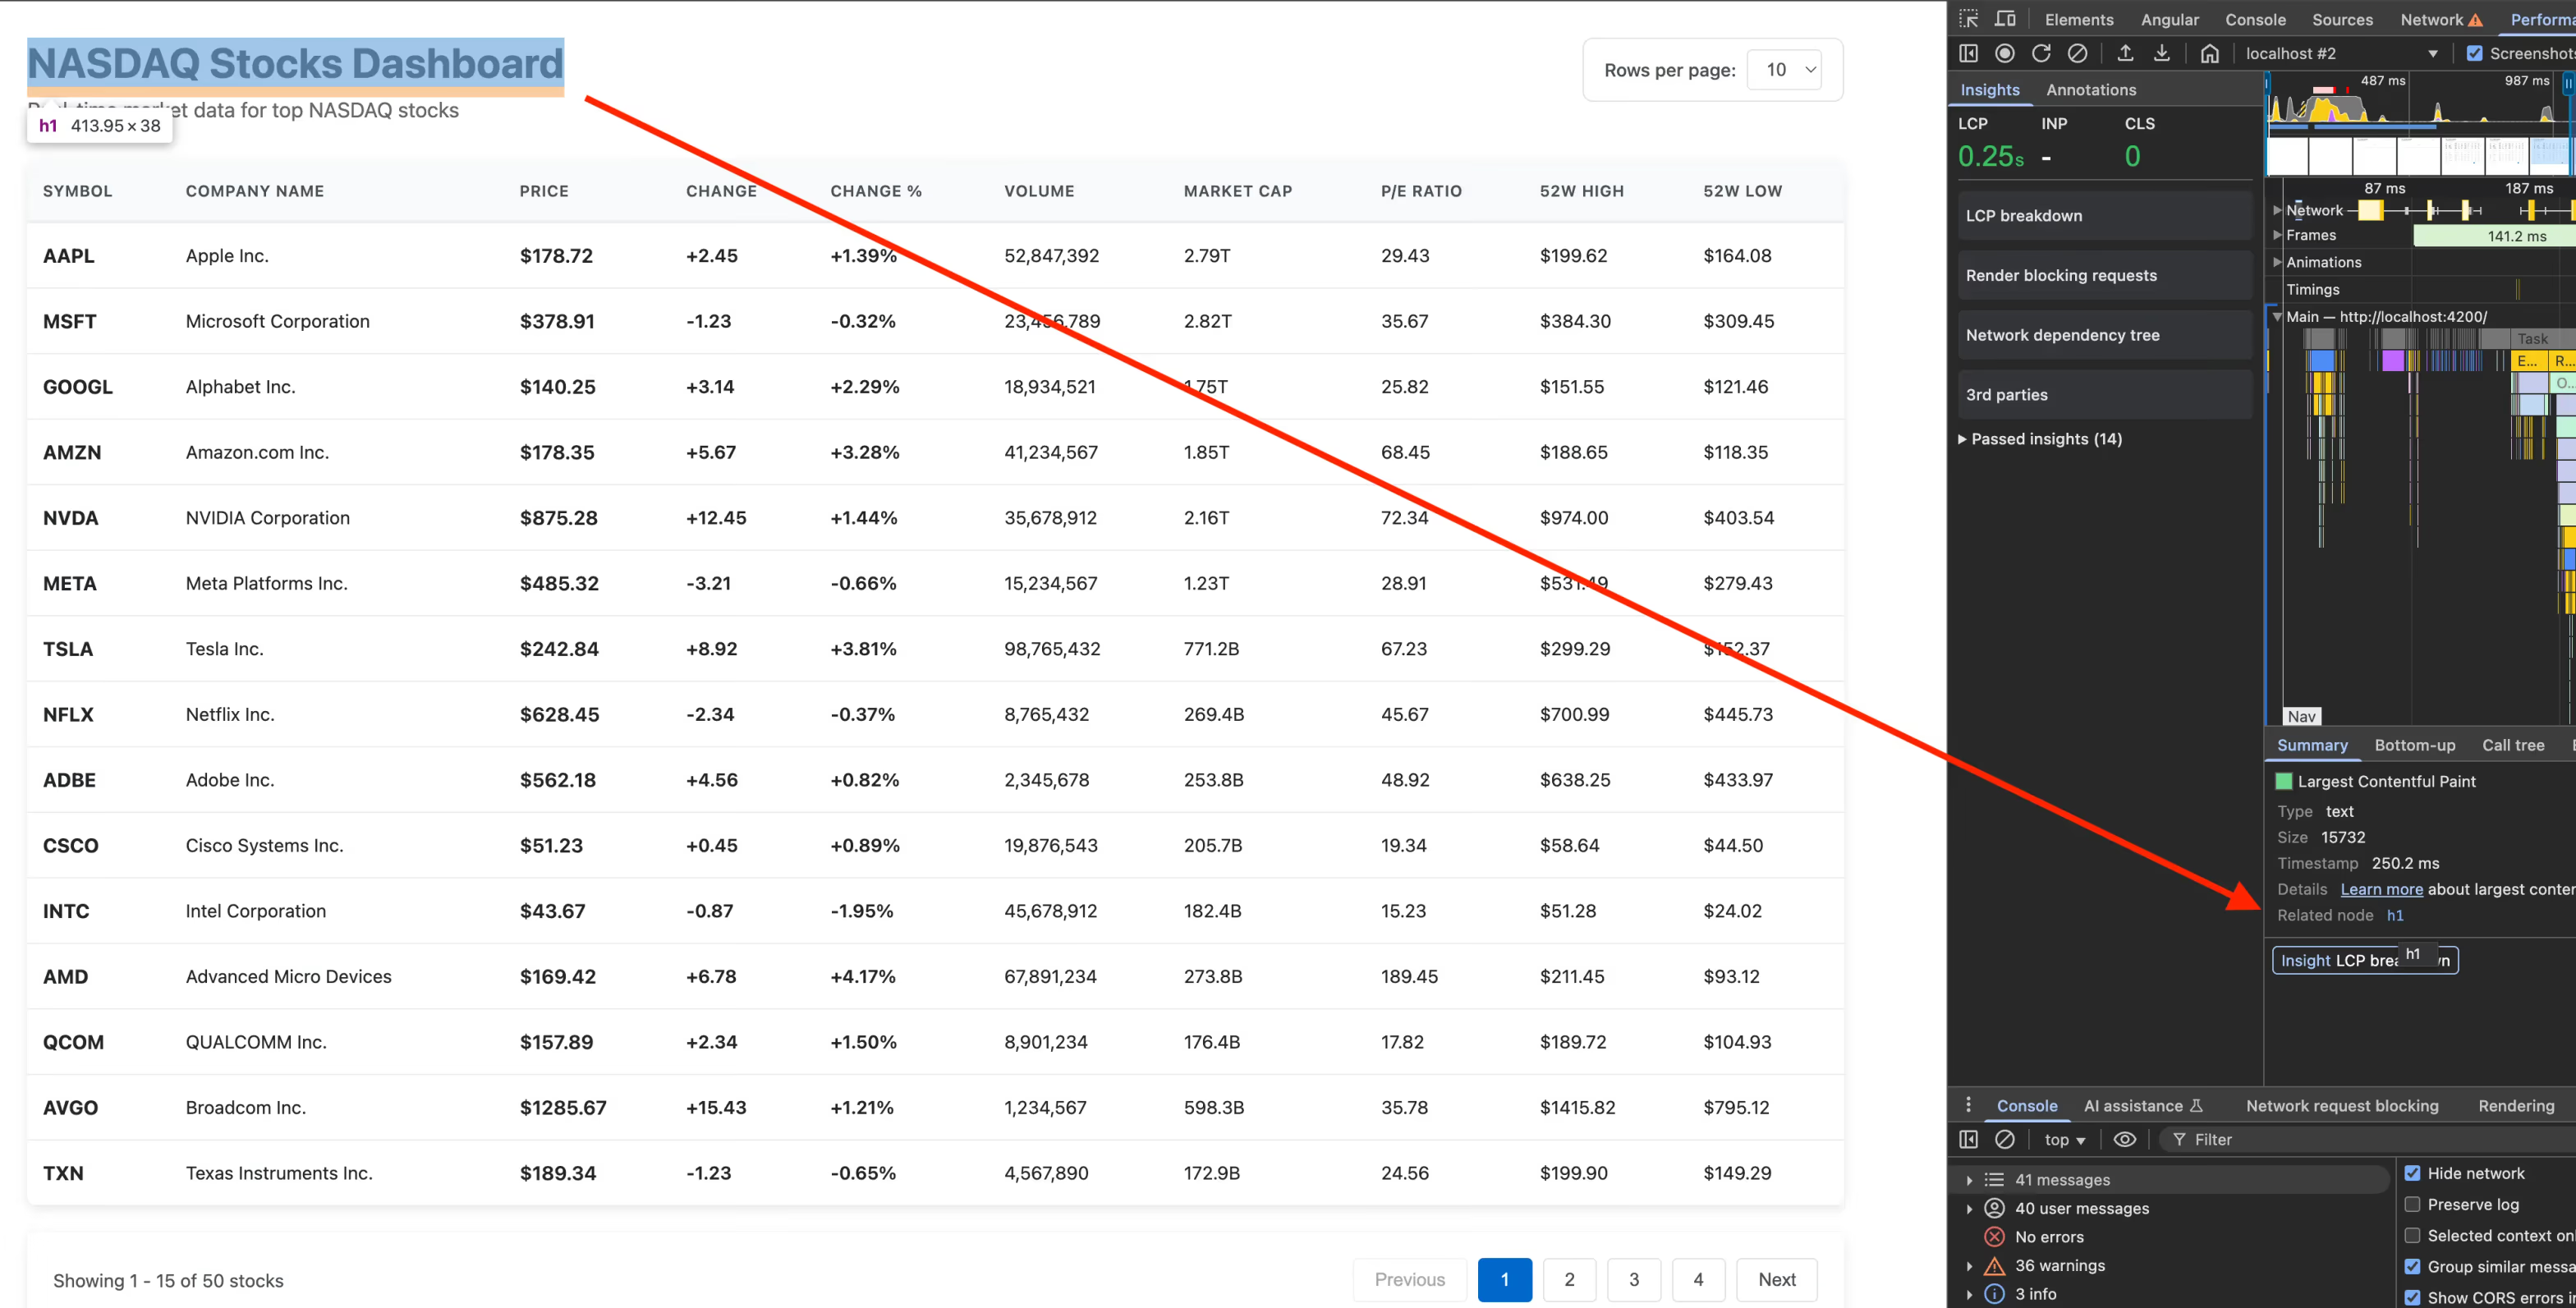
In this app, our table is our most important element but it will not be chosen as LCP. Read more about LCP here.
So, how can we tell our RUM tool that we need timing for our table element? Depending on the number of rows requested (via pagination), the response time will also change.
Getting Performance Data
Let’s get performance data for the API we are interested in. Let’s create a script file and decide what we want to send to Datadog. In this example I want to send rowSize, duration and url.
export class PerformanceTrackerService {
	private observer: PerformanceObserver | null = null;

	stockPerformanceData = {
		rowSize: 0,
		url: '',
		duration: 0
	};
}
To be able to get performance data of our endpoint we are going to use PerformanceObserver. Setting up a PerformanceObserver is super easy. So our code snippet will look like this:
constructor() {
  this.initializePerformanceObserver();
}

initializePerformanceObserver(): void {
  this.observer = new PerformanceObserver((list) => {
    for (const entry of list.getEntries()) {
      // our endpoint looks like this http://localhost:3000/api/stocks
      if (
        entry.entryType === 'resource' &&
        entry.name.includes('/api/stocks')
      ) {
        const resourceEntry = entry as PerformanceResourceTiming;

        // note that we can't set rowSize here
        // as we don't have access to response data here
        this.stockPerformanceData.duration = resourceEntry.duration;
        this.stockPerformanceData.url = resourceEntry.name;

        console.log('Performance entry observed:', entry);
      }
    }
  });

  // Observe resource timing entries
  this.observer.observe({ type: 'resource', buffered: true });
}
What happens here:
- We create an observer that watches for requests in the browser.
- Inside the if block, we filter for our endpoint (
/api/stocks). - When matched, we assign the timing data to
stockPerformanceData.
Since we don’t have access to response body here, we need to get rowSize data somewhere else later.
We also define two helper methods:
/**
 * See Send RUM Custom Actions for further information.
 * https://docs.datadoghq.com/real_user_monitoring/guide/send-rum-custom-actions
 *
 * @param name - Name of the action
 * @param context - Context of the action
 *
 * addAction: (name: string, context?: object) => void;
 */
sendStockPerformanceData(): void {
  datadogRum.addAction('stock_performance', this.stockPerformanceData);
}

/**
 * Disconnect the performance observer
 */
disconnect(): void {
  if (this.observer) {
    this.observer.disconnect();
    this.observer = null;
  }
}- One to send our data to Datadog (via
@datadog/browser-rum) as a custom action. - One to disconnect the observer. If you don’t disconnect it, the observer will keep looping through resource entries even when your users navigate to a different page.
Integrating with Your Component
I was doing this sample app with Angular, so here I am using HttpClient to fetch data, but it doesn’t matter - whatever you use, the code block below will be identical.
First of all we inject the performanceTracker class, so we can access its methods:
export class StocksTableComponent {
  private performanceTracker = inject(PerformanceTrackerService);

  // ... inside your subscription
  this.stocksService
    .subscribe({
      next: (response) => {
        this.stocks.set(response.stocks); // this updates our UI

        // below we update our stockPerformanceData that we previously defined
        this.performanceTracker.stockPerformanceData.rowSize = response.stocks.length;

        // time to send this data to datadog!
        this.performanceTracker.sendStockPerformanceData();
      }
    });
}
Once we successfully fetch the data from the endpoint, we assign the response length as rowSize. Then, we call sendStockPerformanceData().
That’s it. That’s all the code we need. Now we need to go to Datadog UI and make use of this data!
Visualizing in Datadog
When we go to Datadog RUM and select actions, we will see our custom action is being sent to Datadog. Clicking on that row shows the custom attributes we sent.
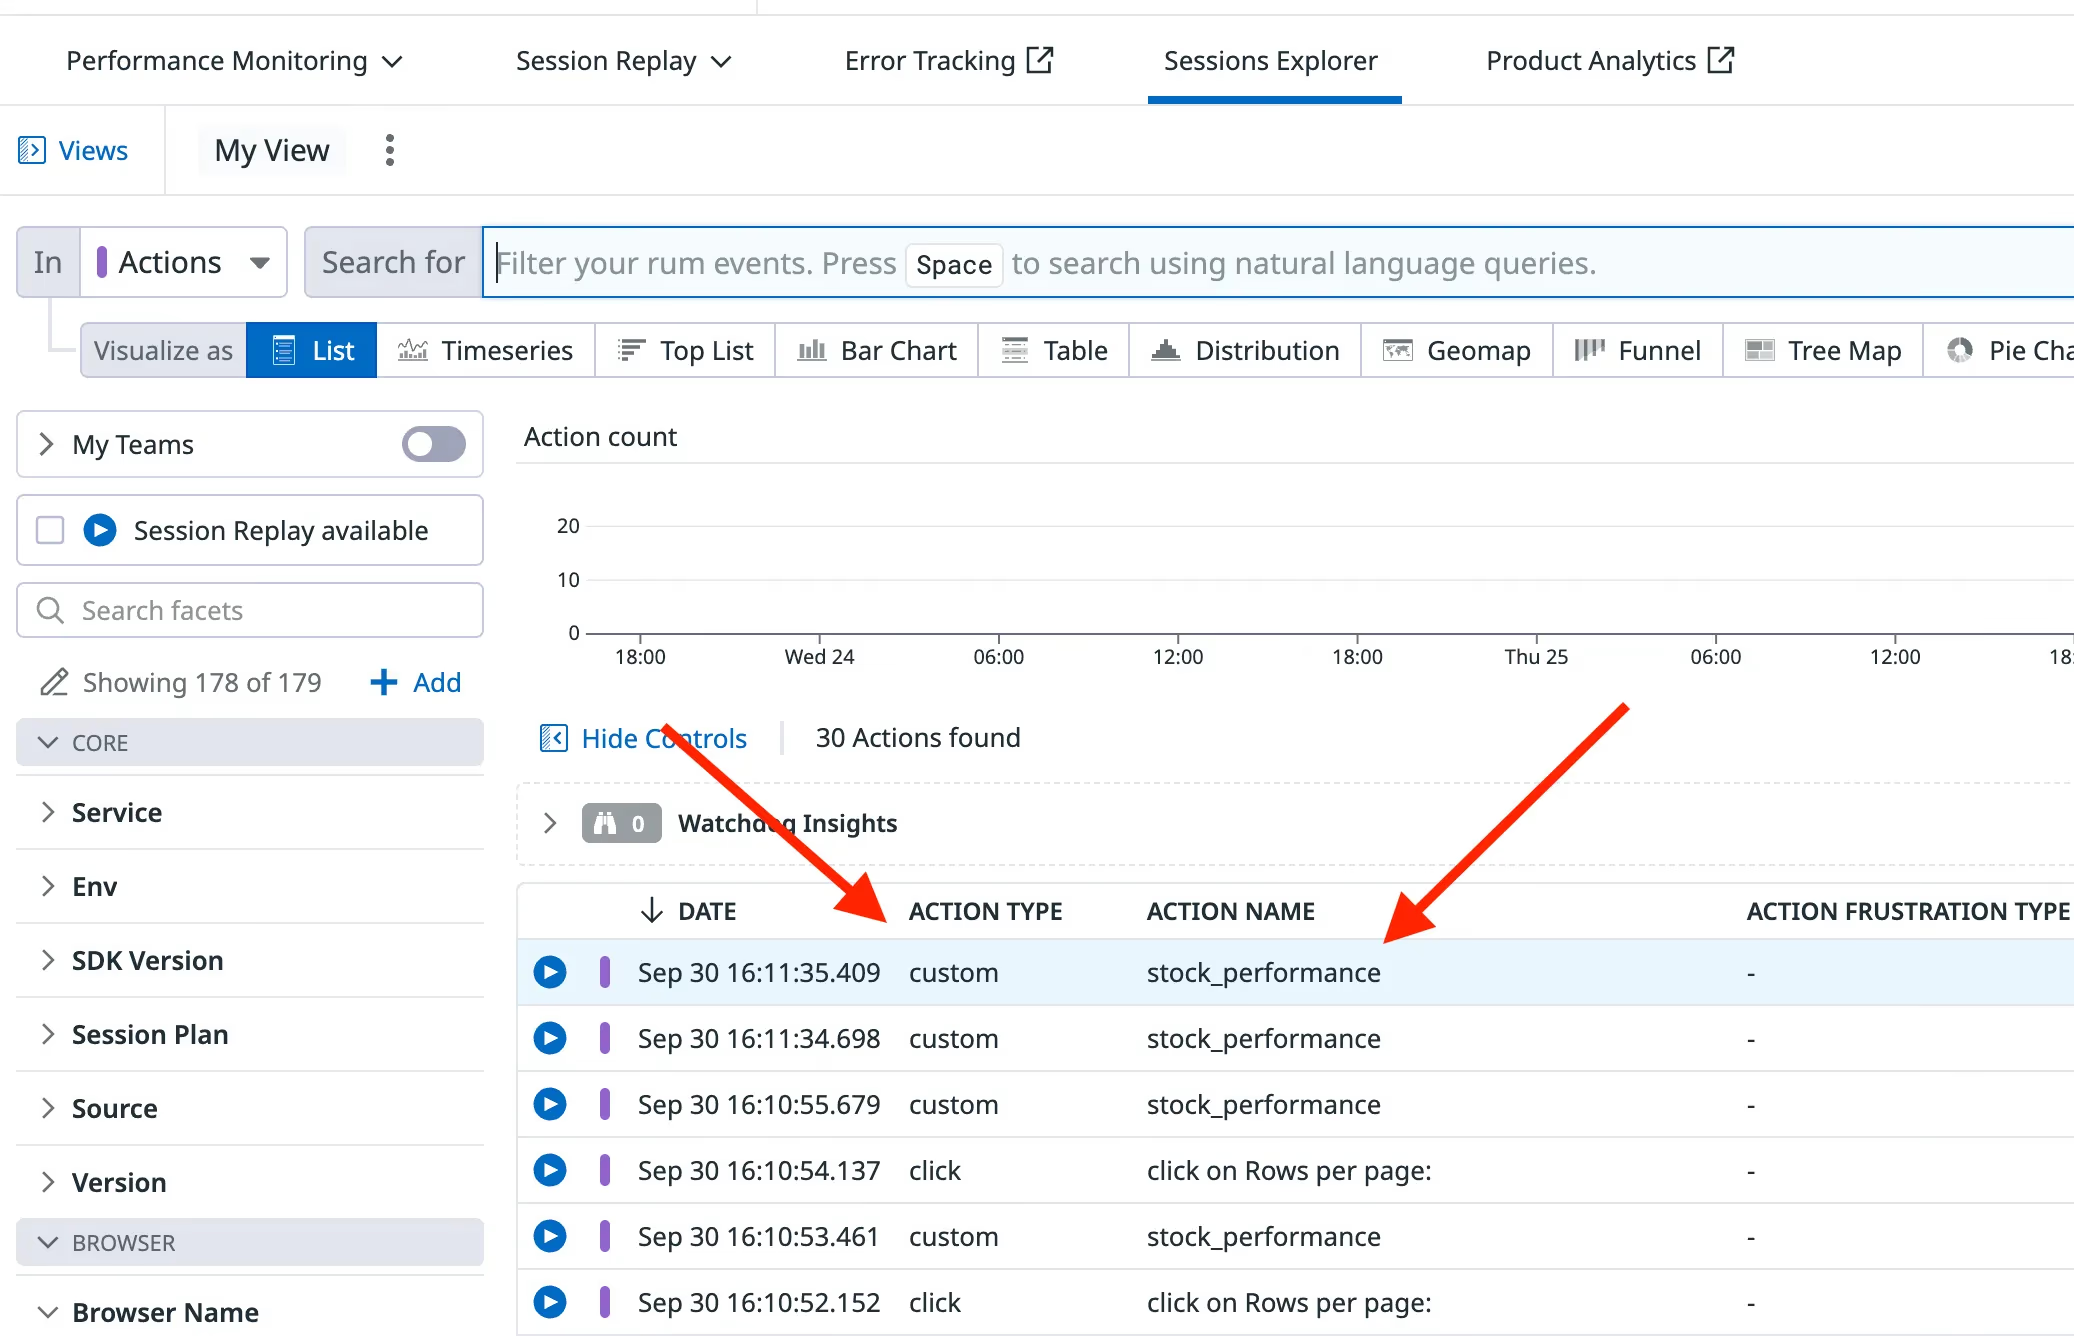
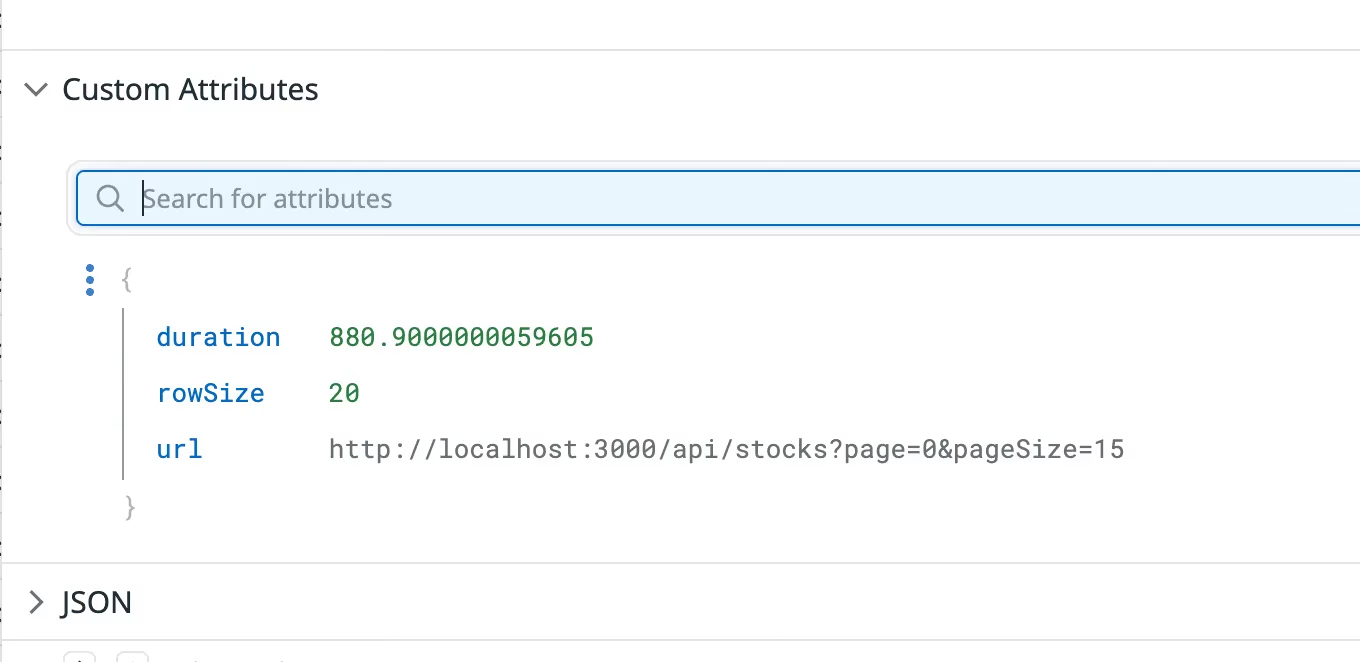
Next, we need to create a facet from these custom attributes for visualization. For example, duration is something we want to measure, so we’ll create a measurable facet for it.
We’ll give this facet a custom name, such as stockDuration. This is the name we’ll use when querying.
After creating this facet, now we are ready to visualize this measurable unit.
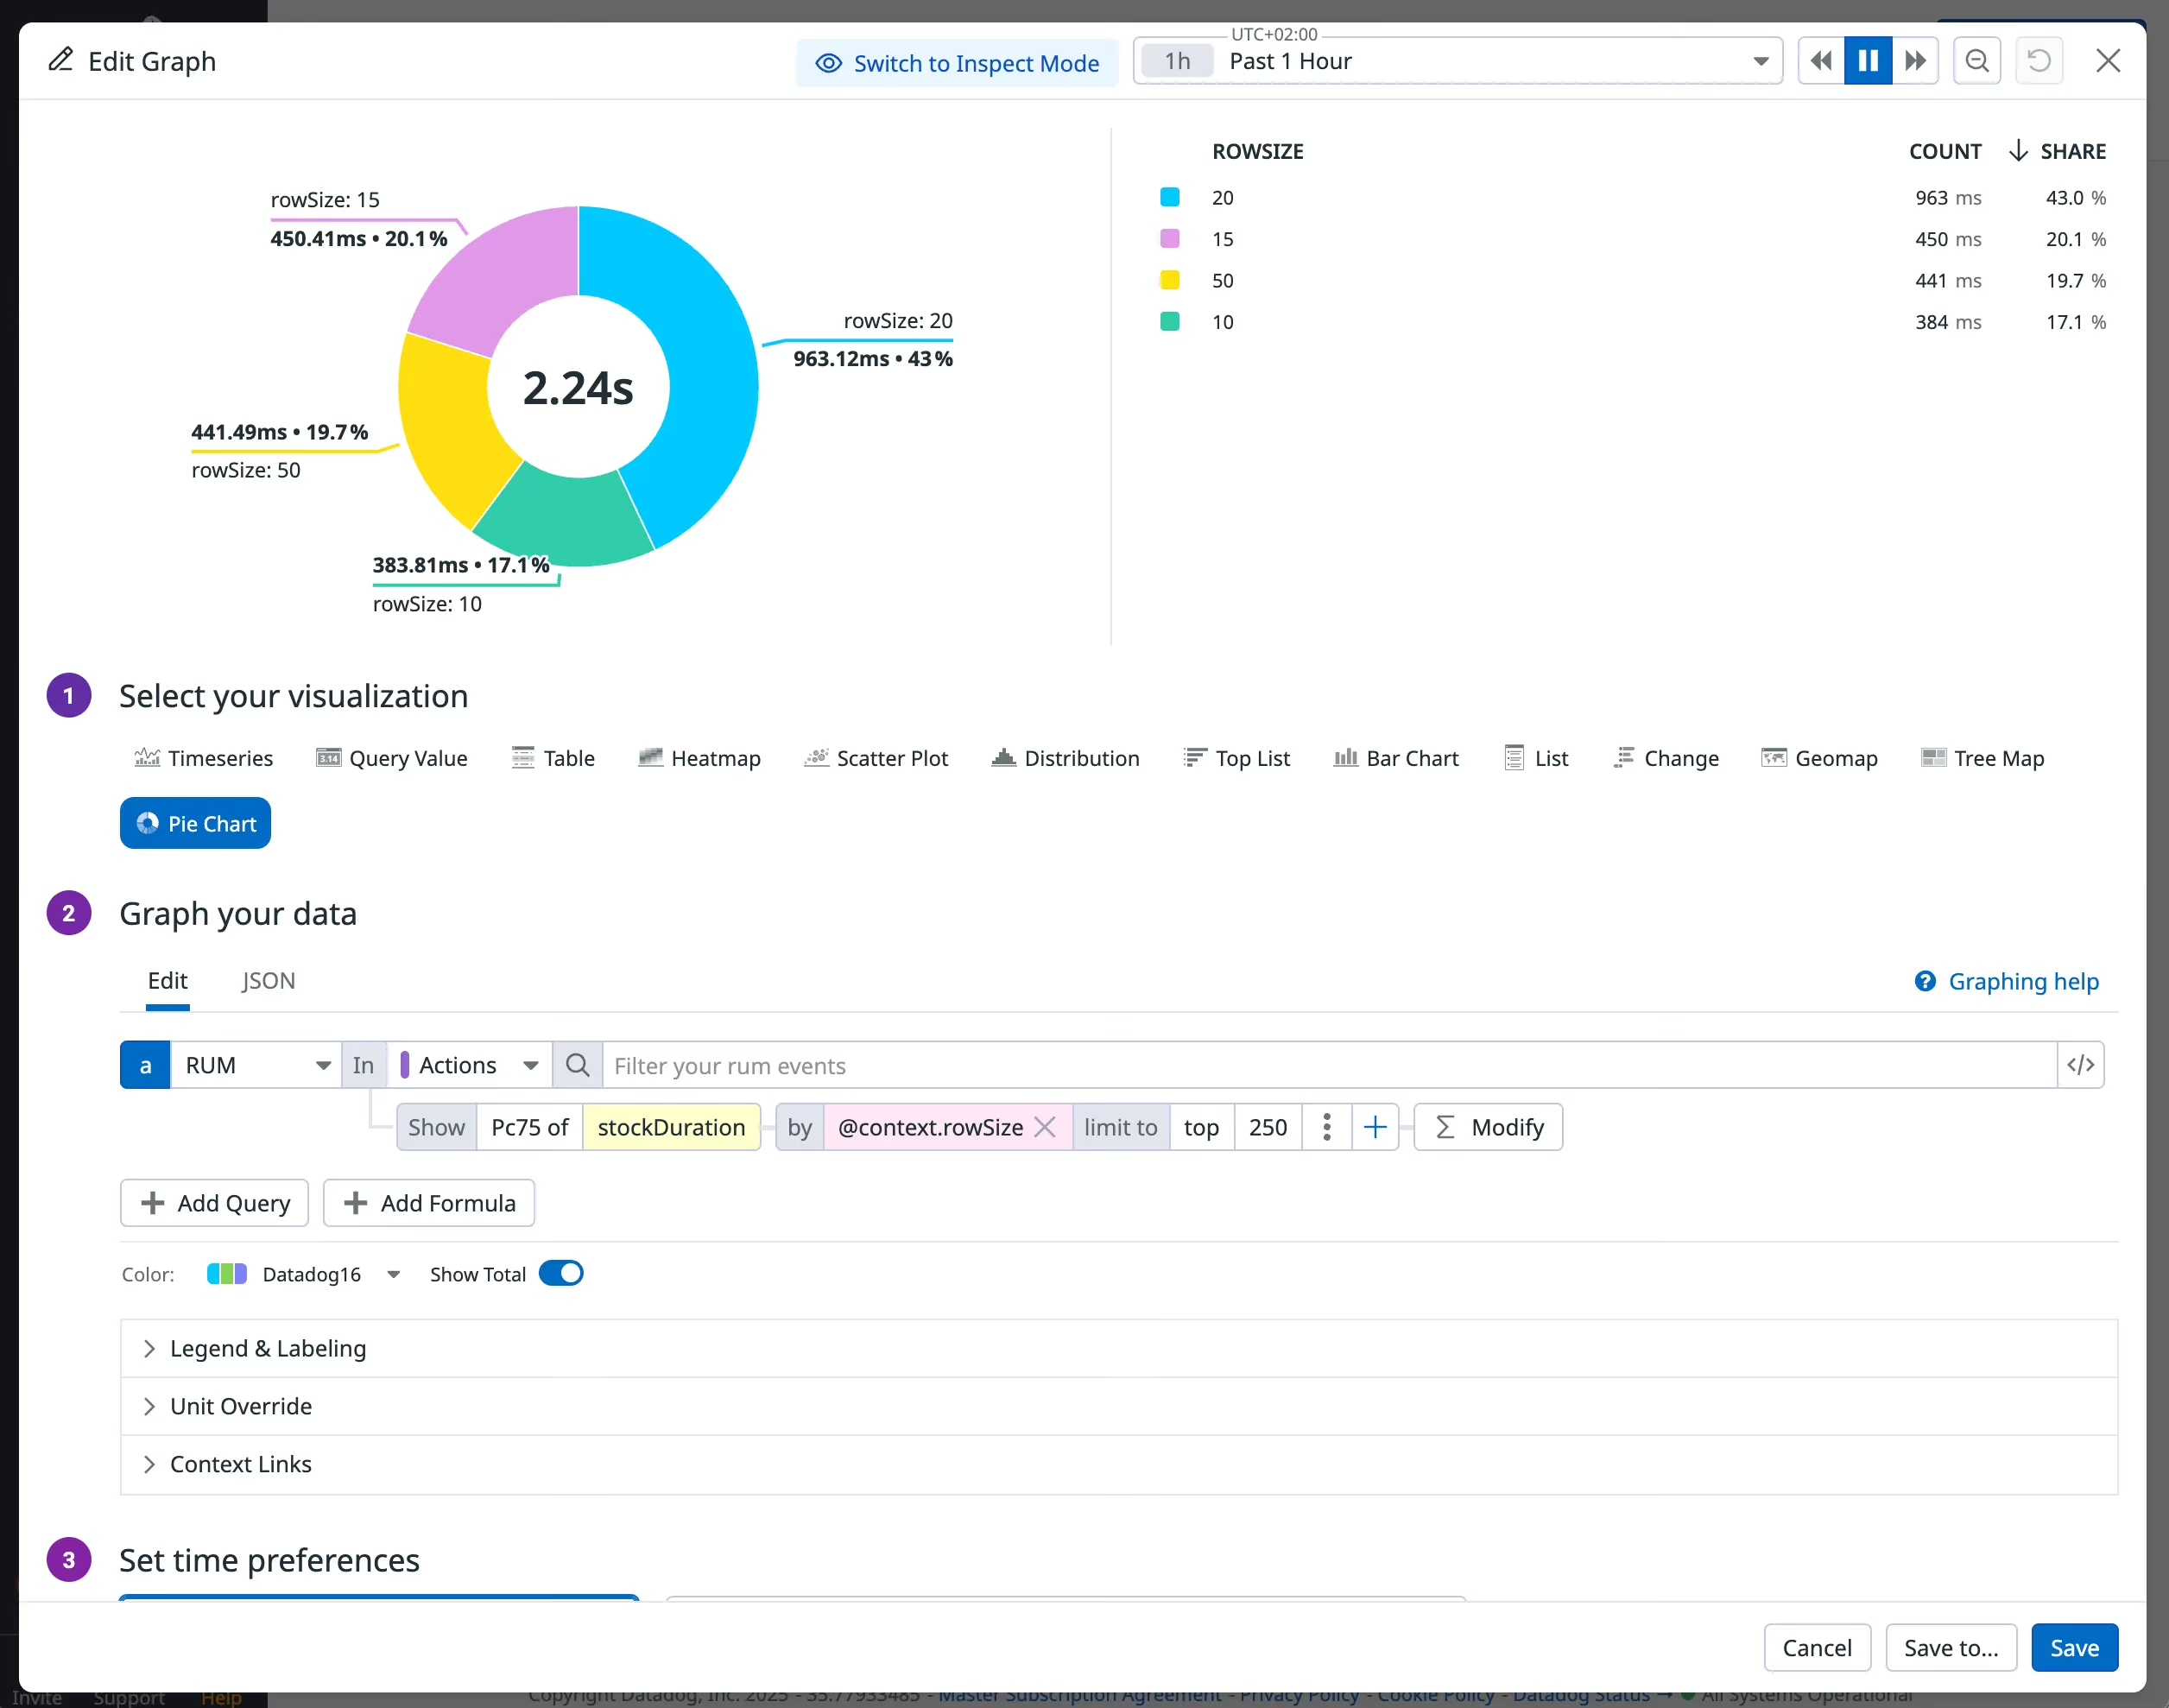
But remember: we wanted to correlate rowSize and response time. After creating a facet for rowSize as well, we can plot a two-axis visualization of rowSize and stockDuration.
Now we can see the relationship between our response size and response duration.
Are We Measuring the Right Thing?
So here is the tricky part.
Now we can go to our backend developers/product owners and say: “Here are the endpoint performance results, done via browser data” - and you can impress your team.
But keep in mind: we are measuring request duration here. Which means we still don’t know how long it takes to render our Nasdaq table to the user.
Let’s check our UI again. We have an <h1> element and then we have our table.
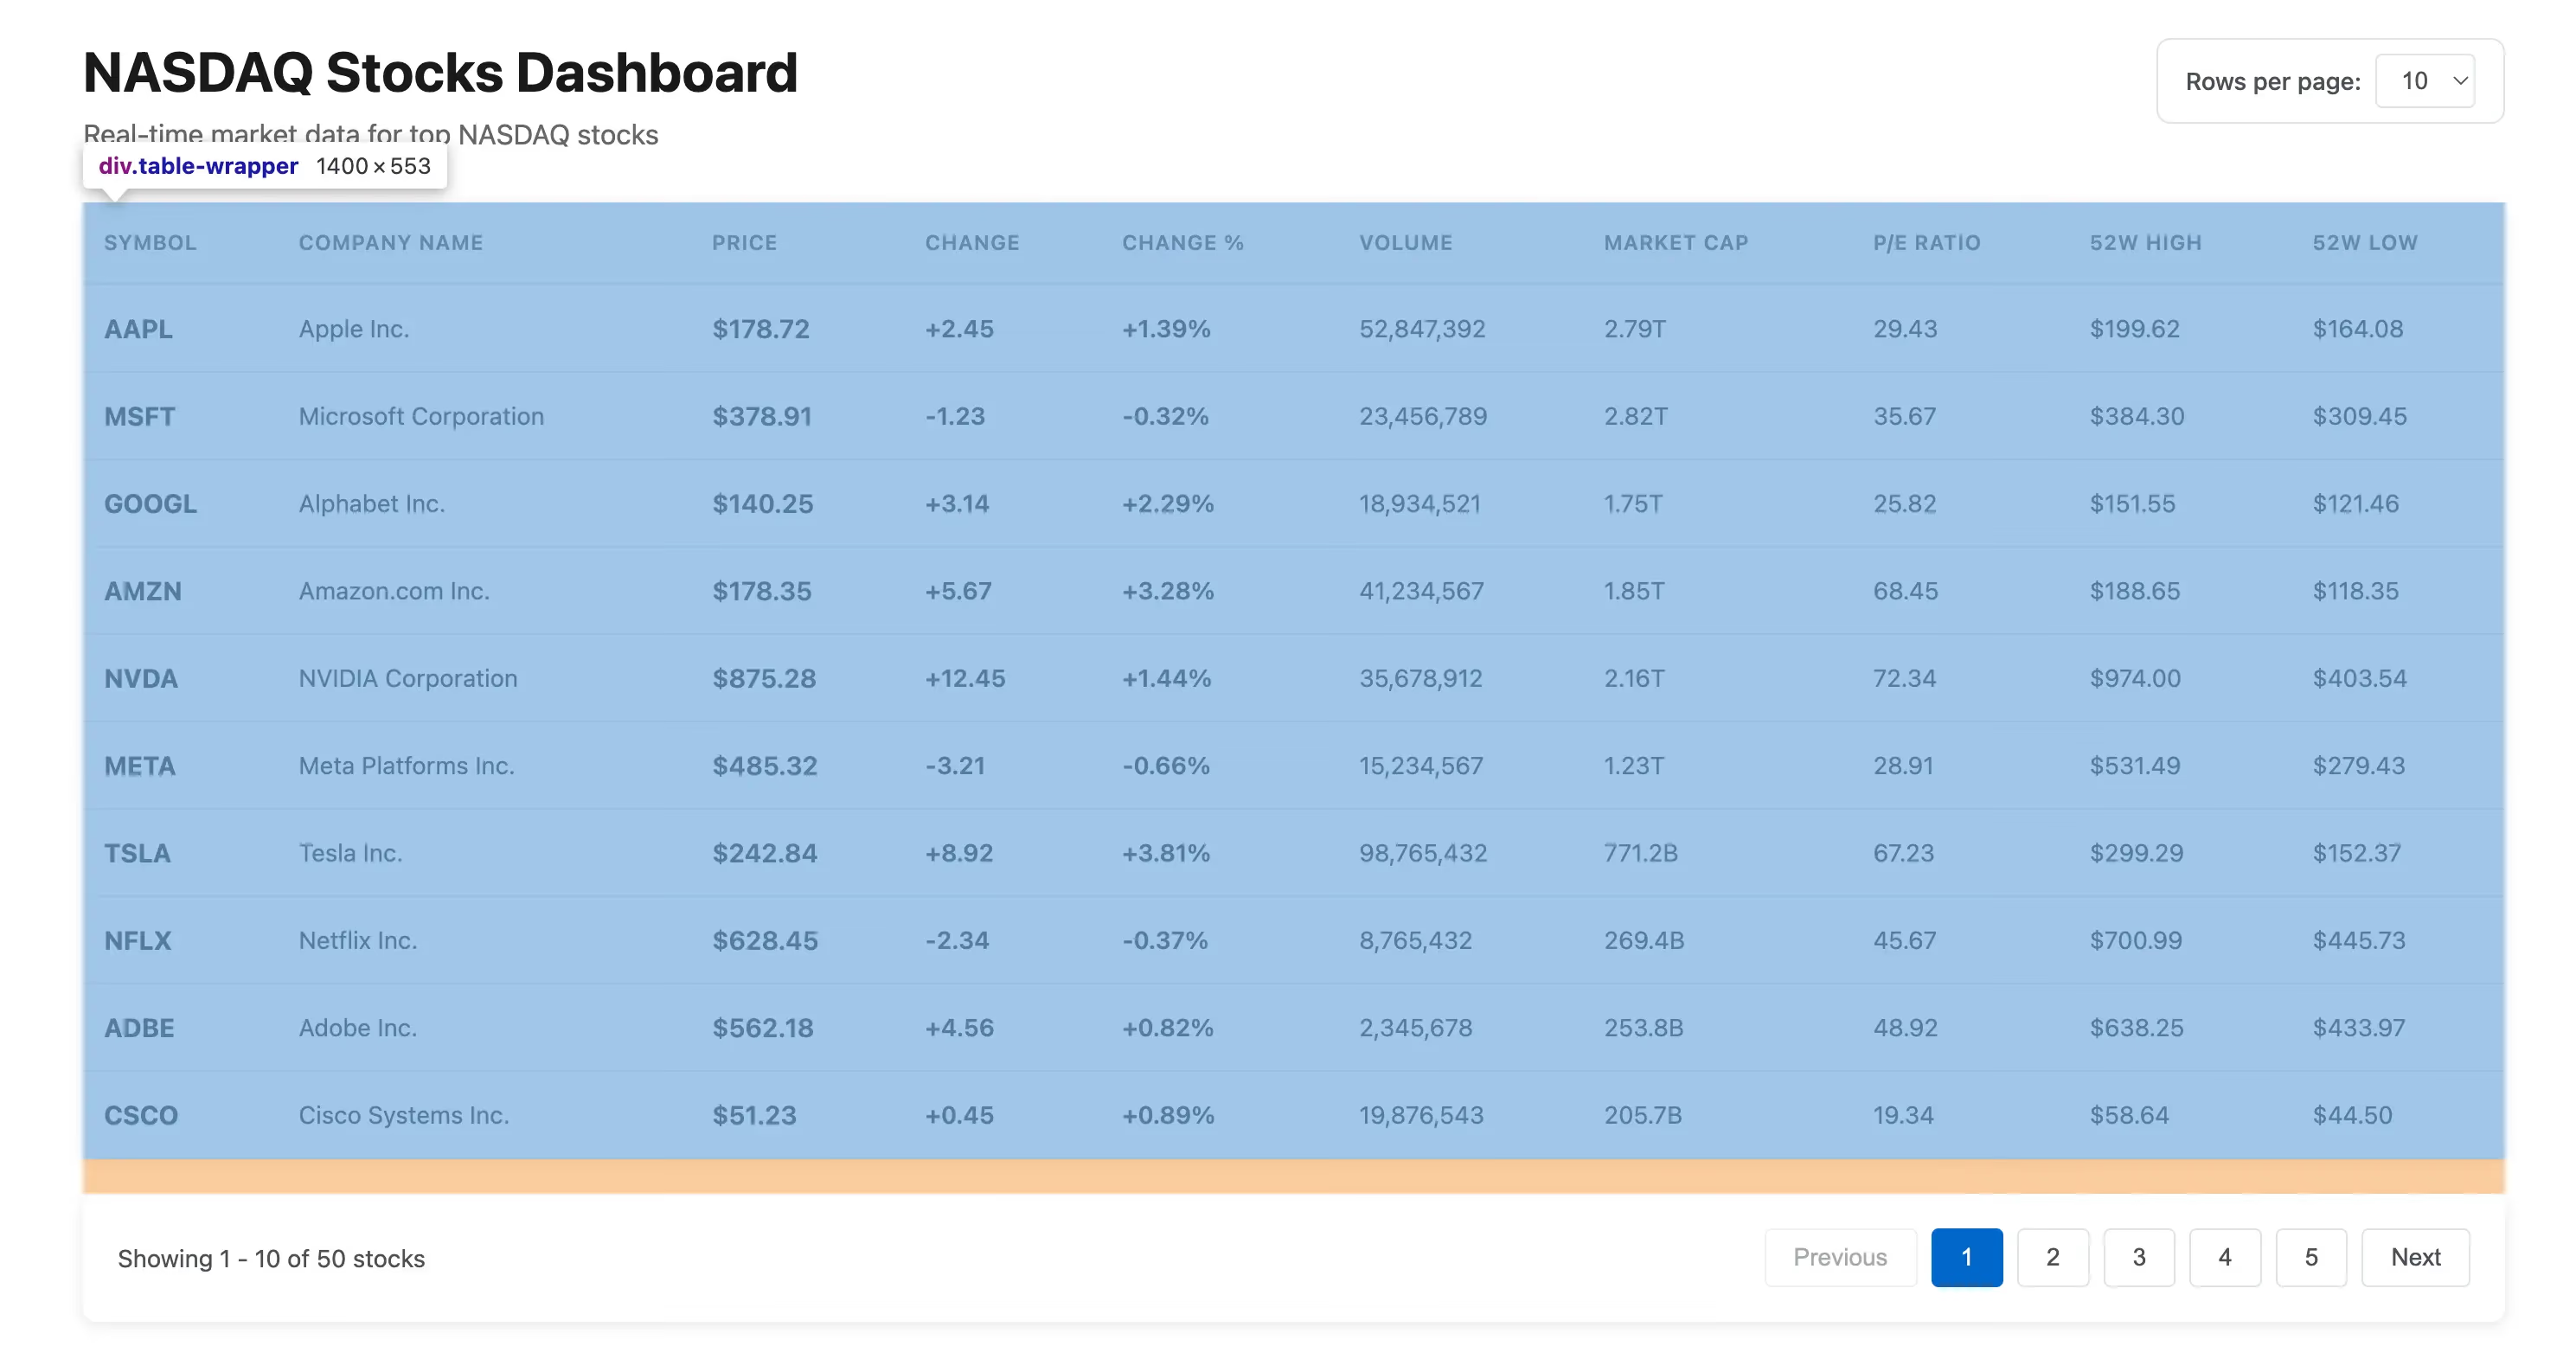
Most likely you are developing different components in your framework/library and rendering it like this:
<h1>NASDAQ Stocks Dashboard</h1>
<table-component></table-component>
The moment after the <h1> element is attached to DOM, we are attaching our table component and a bunch of JavaScript code is running there, including our API request.
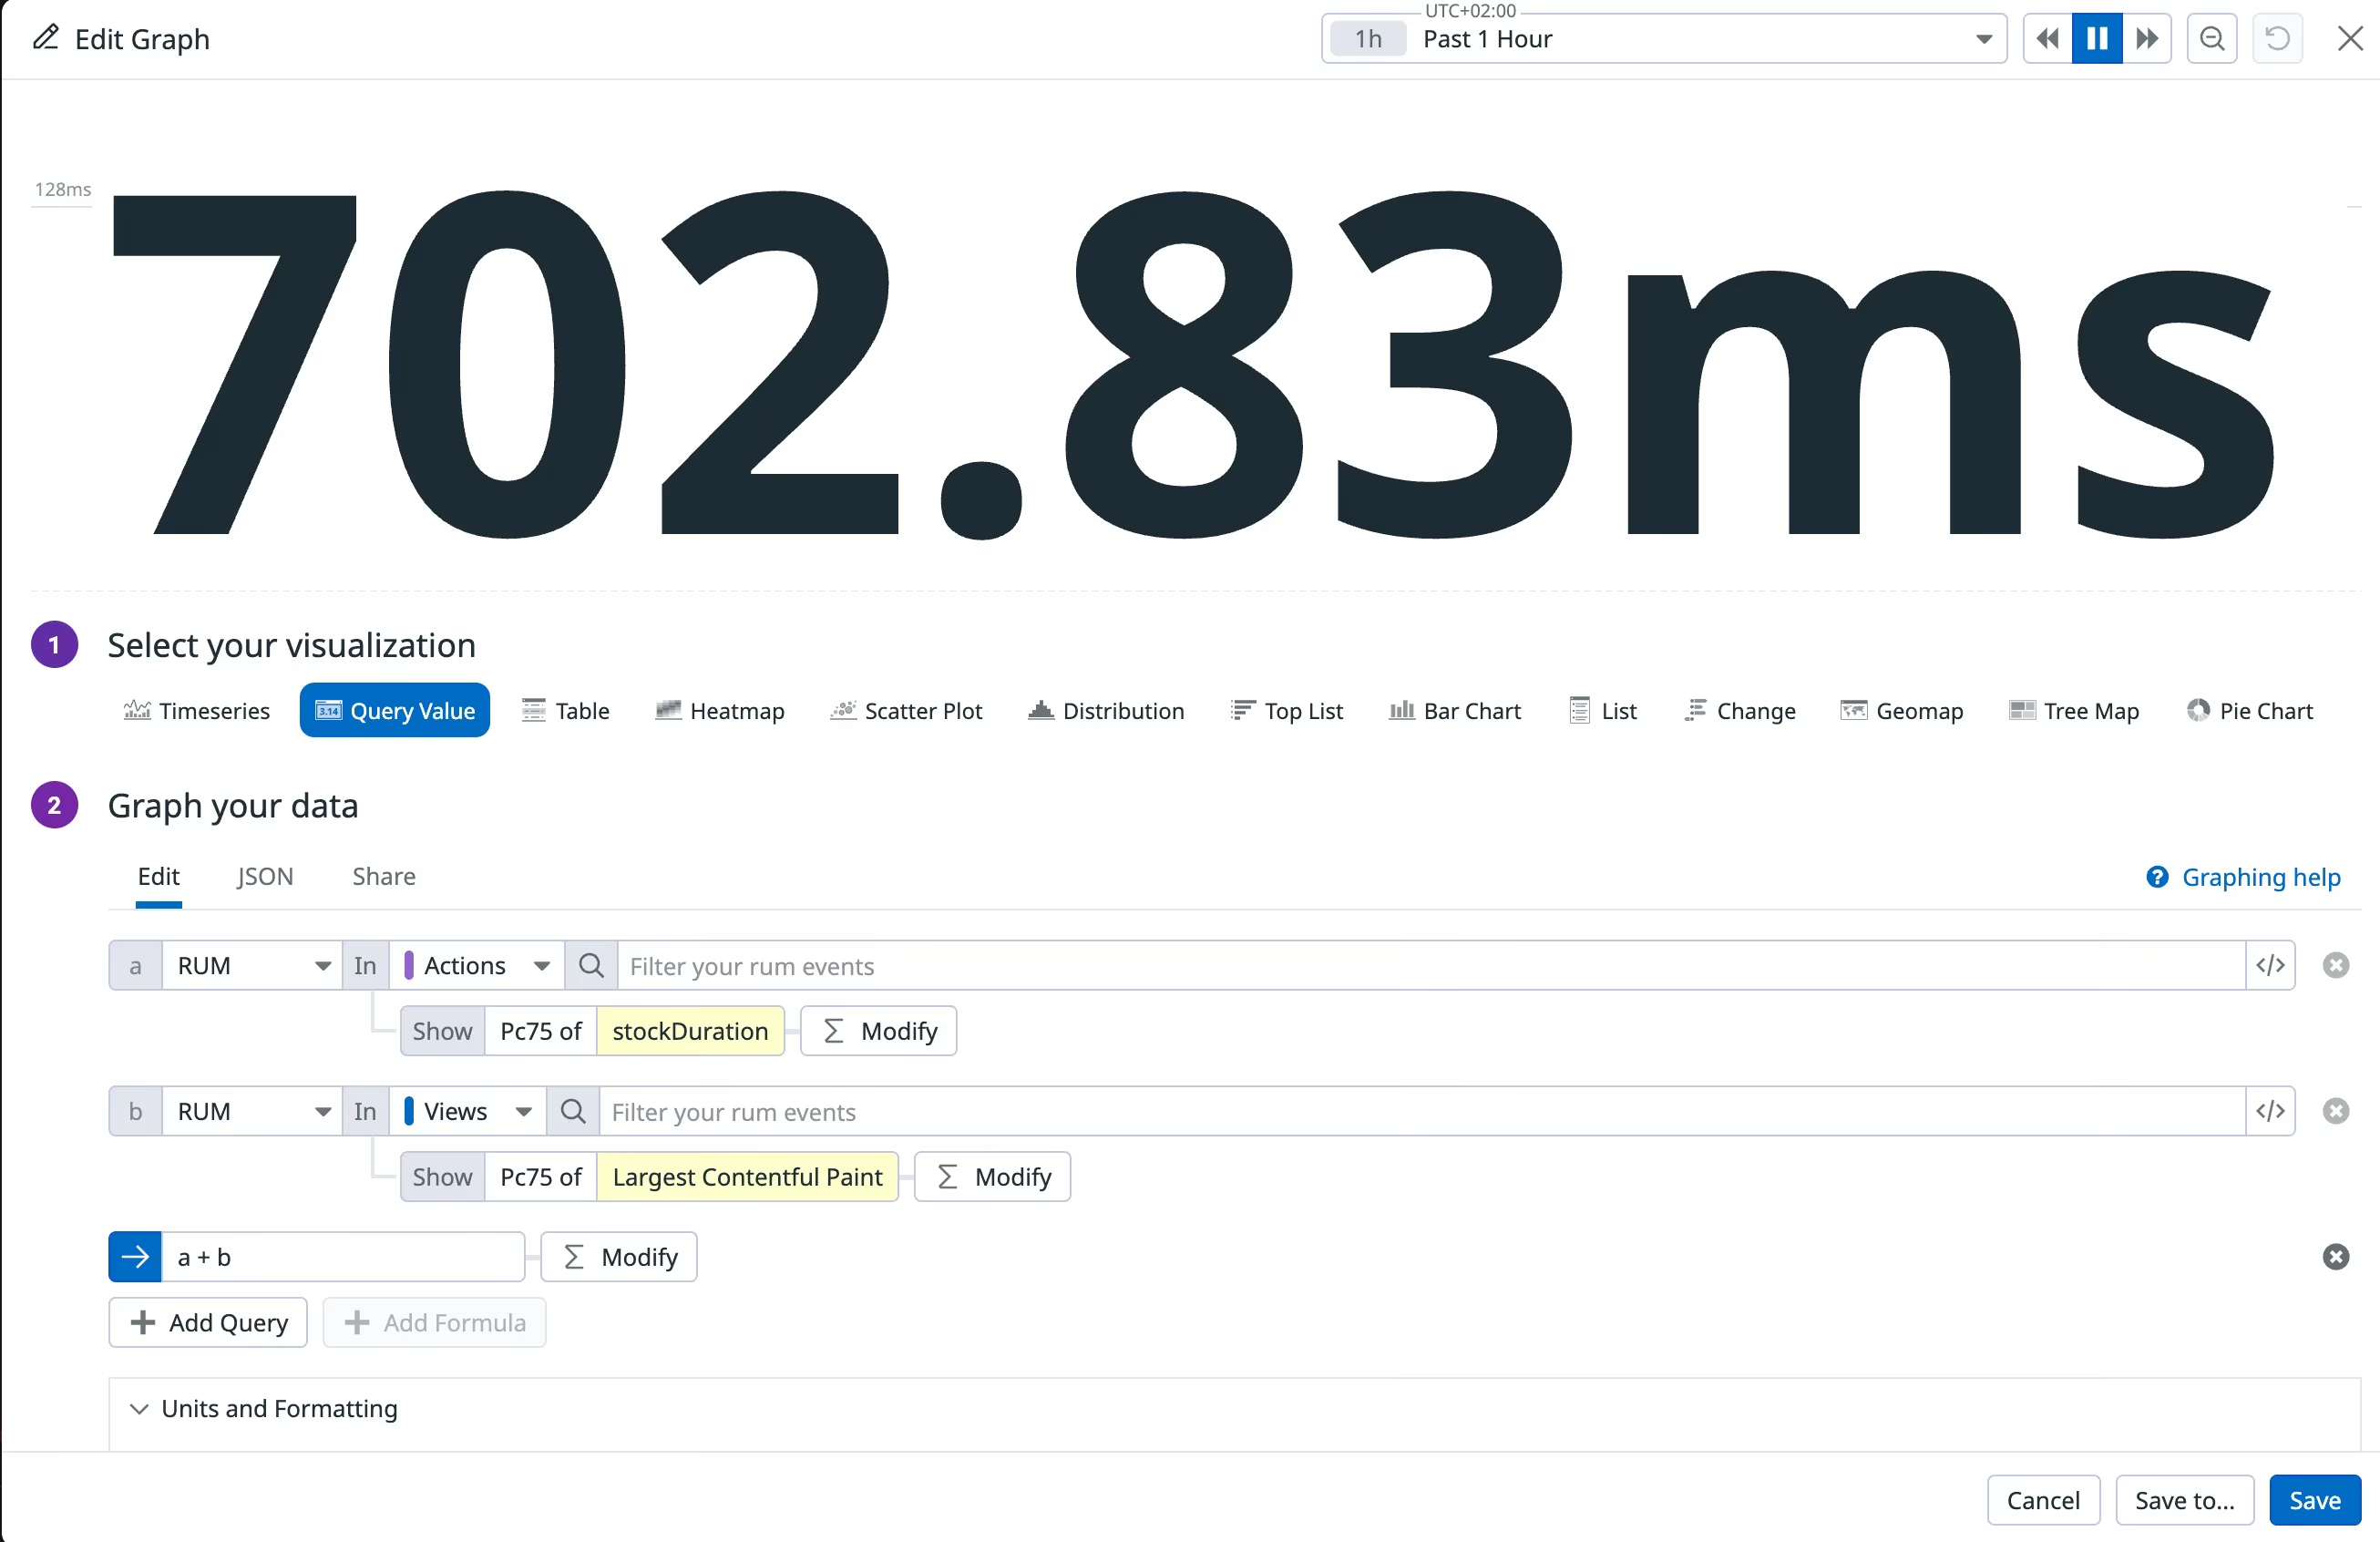
So then can we assume our table render time will be LCP + response duration?
Well, this won’t be 100% accurate estimation, but still better than nothing. Keep in mind: request duration != render time.
Closing Notes
I have been following this approach for the last few years to make data more accessible to my team.
When it comes to measuring when a specific element is painted in the DOM, fortunately, there is ongoing work for measuring this in the browser. Check out more about Container Timing.