
What is a good product (a digital one)? The answer to this question is not easy and varies a lot based on different factors. I want to share my vision and thoughts about how I approach developing digital products on the web.
For me, great UX always starts with great performance but is not limited to that. I admit that I am a bit biased towards performance because I'm a software engineer (and I cannot deny the fact that I'm a bit of a perfectionist, which I'm not so proud of, but anyways!).
I want to show how important RUM (Real User Monitoring) is for your product and evaluating UX of your application. And I will show what Datadog RUM is capable of as of today (May 2024). This post will be more like a 101-level introduction, so we won't go into details and will fly low on the surface.
We use Datadog for RUM in my team. Datadog offers a lot of different monitoring tools for your infrastructure and cloud monitoring, and it is infamous for their pricing model :) But if you only want to use the RUM feature, I think it is reasonably priced (so far), and you pay by the amount of sessions logged.
There are tons of other great RUM products in the market and they all do an amazing job:
- RUMvision - Real-time data on user experiences and Core Web Vitals
- DebugBear - Monitor Page Speed and Core Web Vitals
- SpeedCurve - Website Performance Monitoring
Why RUM?
Why do we even need RUM? Don't we already have a good logging system in our cloud? Let's start with that.
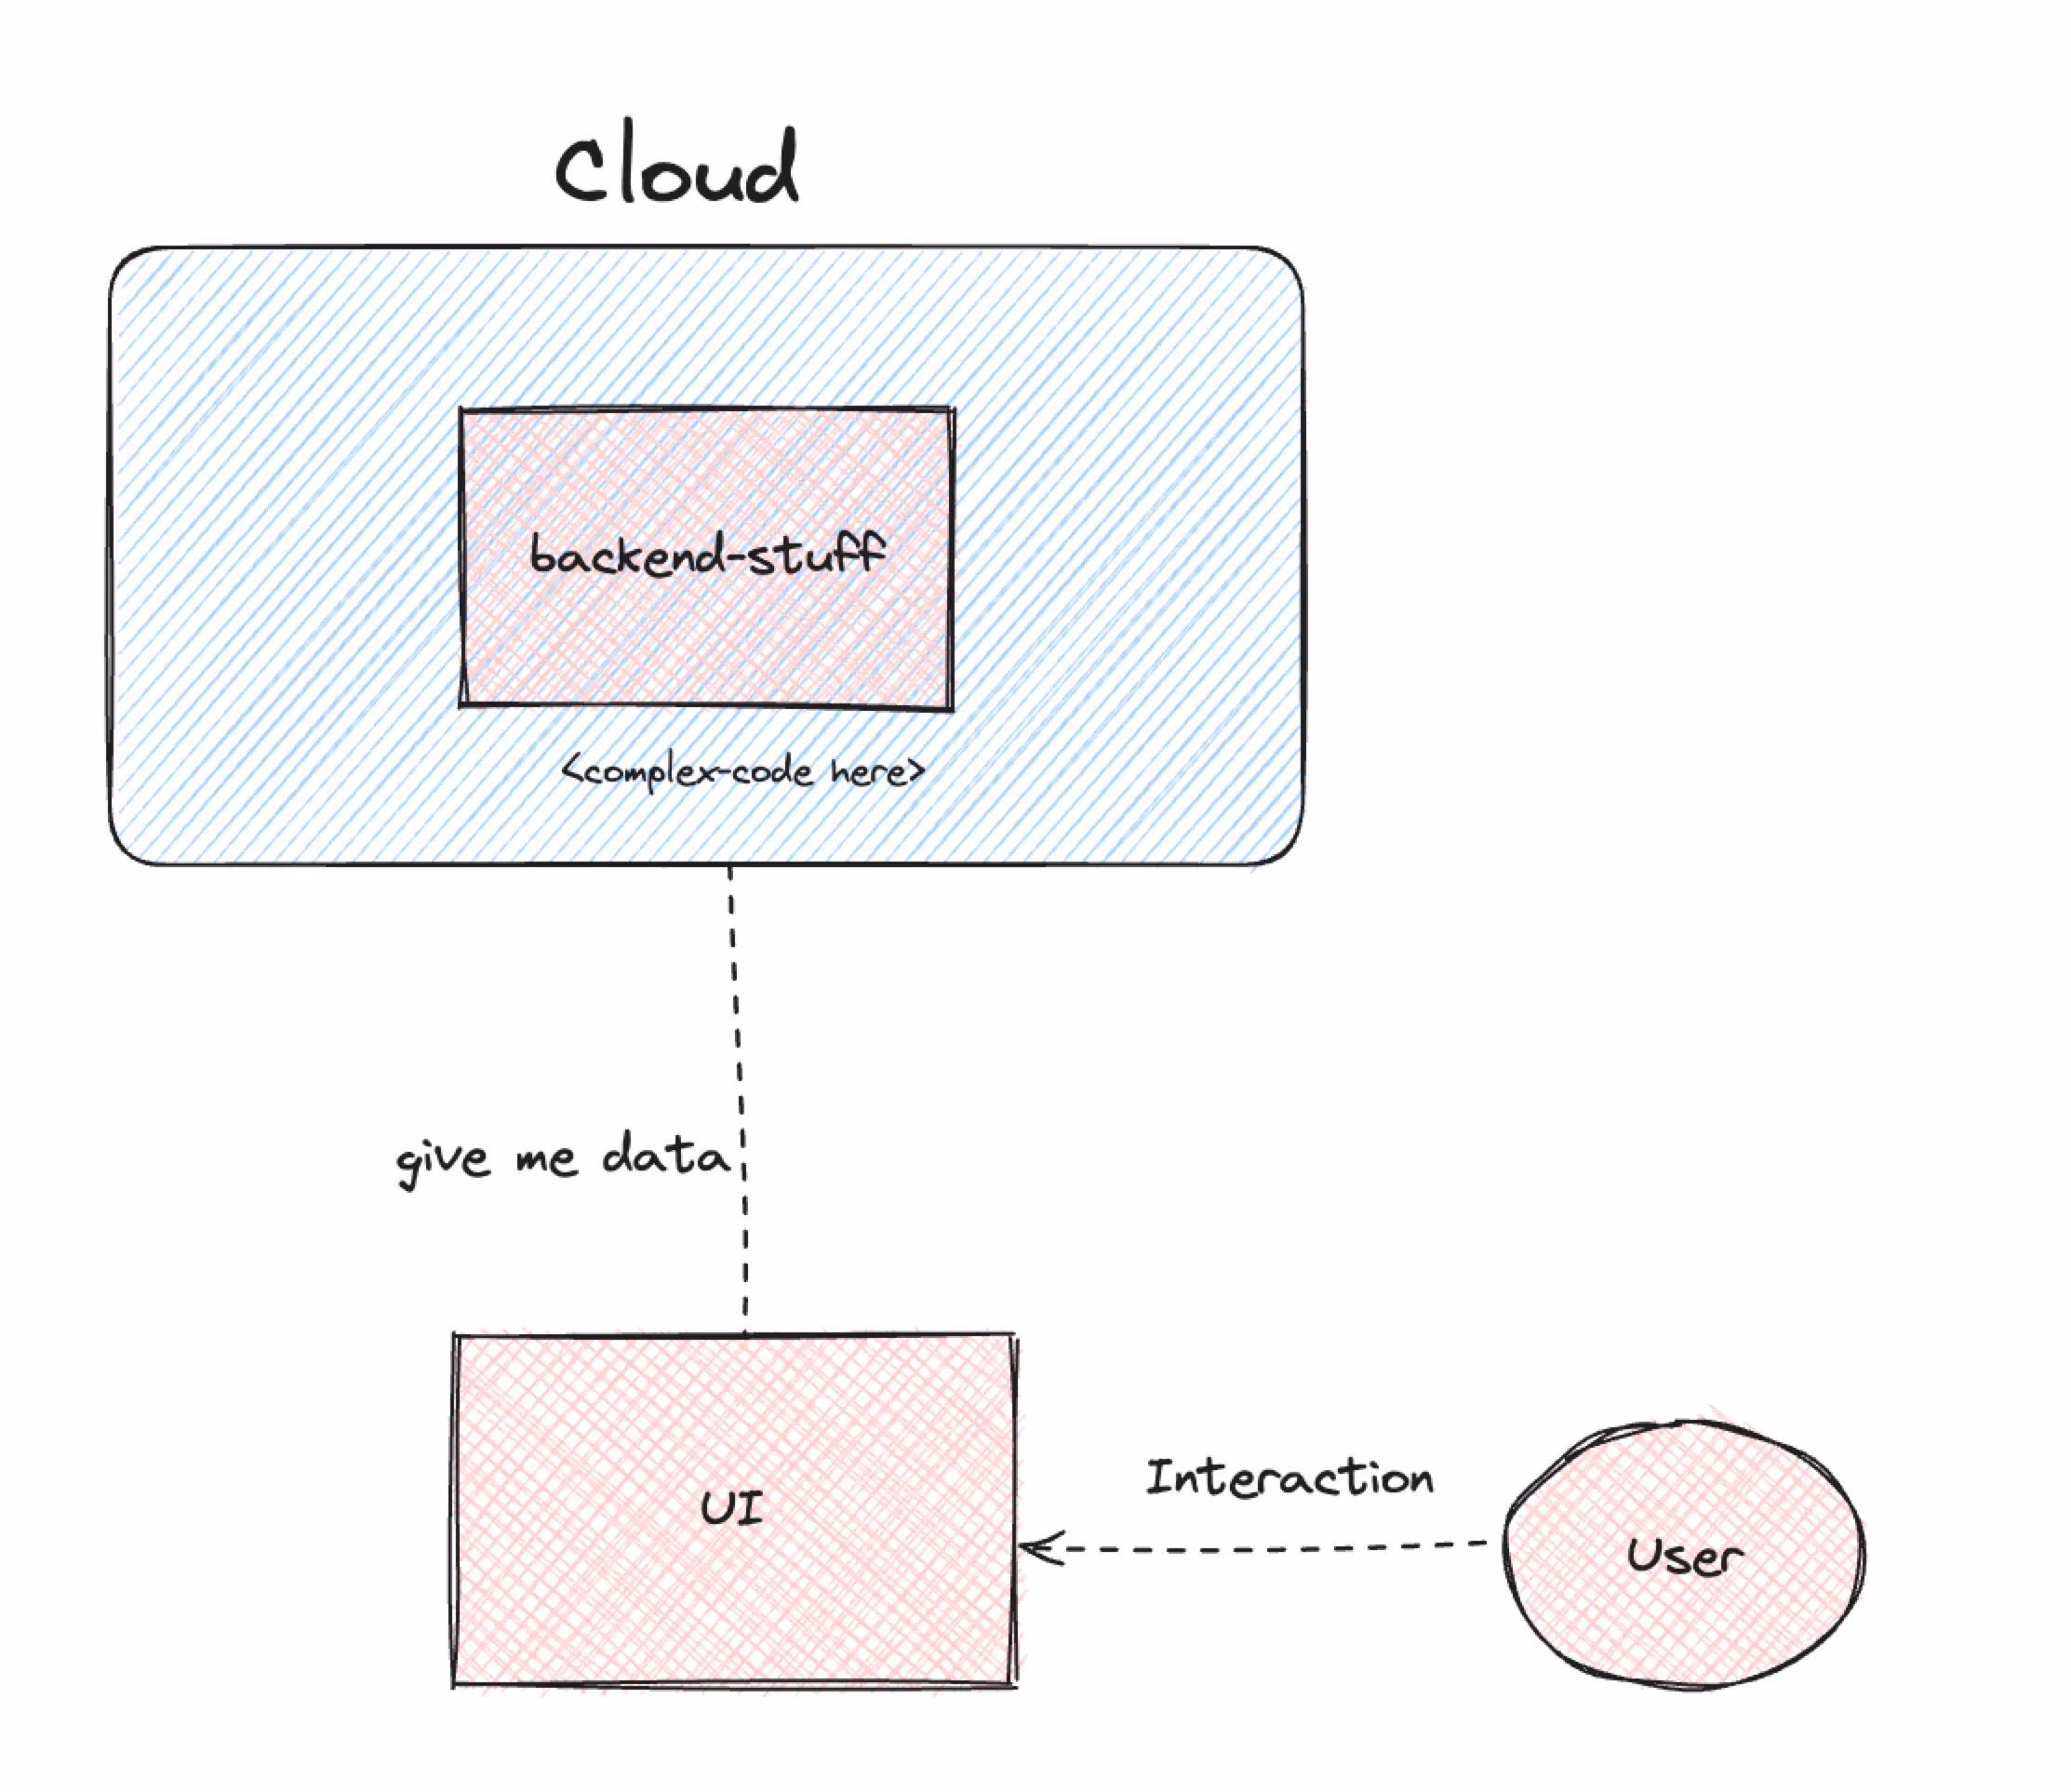
Your app is probably stored in the cloud and has some complex back-end components where you manage your business logic. Then, you expose your business to users through a front-end application in the web browser (or a mobile app!).
You have full control over your cloud infrastructure. You know which hardware your systems are running on, and you can scale it with just one click. If your APIs throw errors or have response time issues, you can easily monitor these aspects using your cloud provider's tools.
However, in the UI layer, your application runs on the user's device where you have no control (or info) over their hardware. You don't know what errors are logged in the user's browser, and so on. This makes it a black box for you. Moreover, as your users interact with your application, you might want to know how they are using it and where errors occur. This is where Real User Monitoring (RUM) comes into play and can be extremely helpful.
RUM can assist not only in debugging errors; if a session replay feature is supported, it can also help you evaluate some aspects of your UX performance.
Let's Start
When you implement @datadog/browser-rum into your application via npm (or CDN link):
npm i @datadog/browser-rumIt will start logging the user sessions and out of the box it will give you some pre-built dashboards. Since Datadog is quite big and provides a lot of other monitoring tools, RUM related logs are listed under the Digital Experience tab.
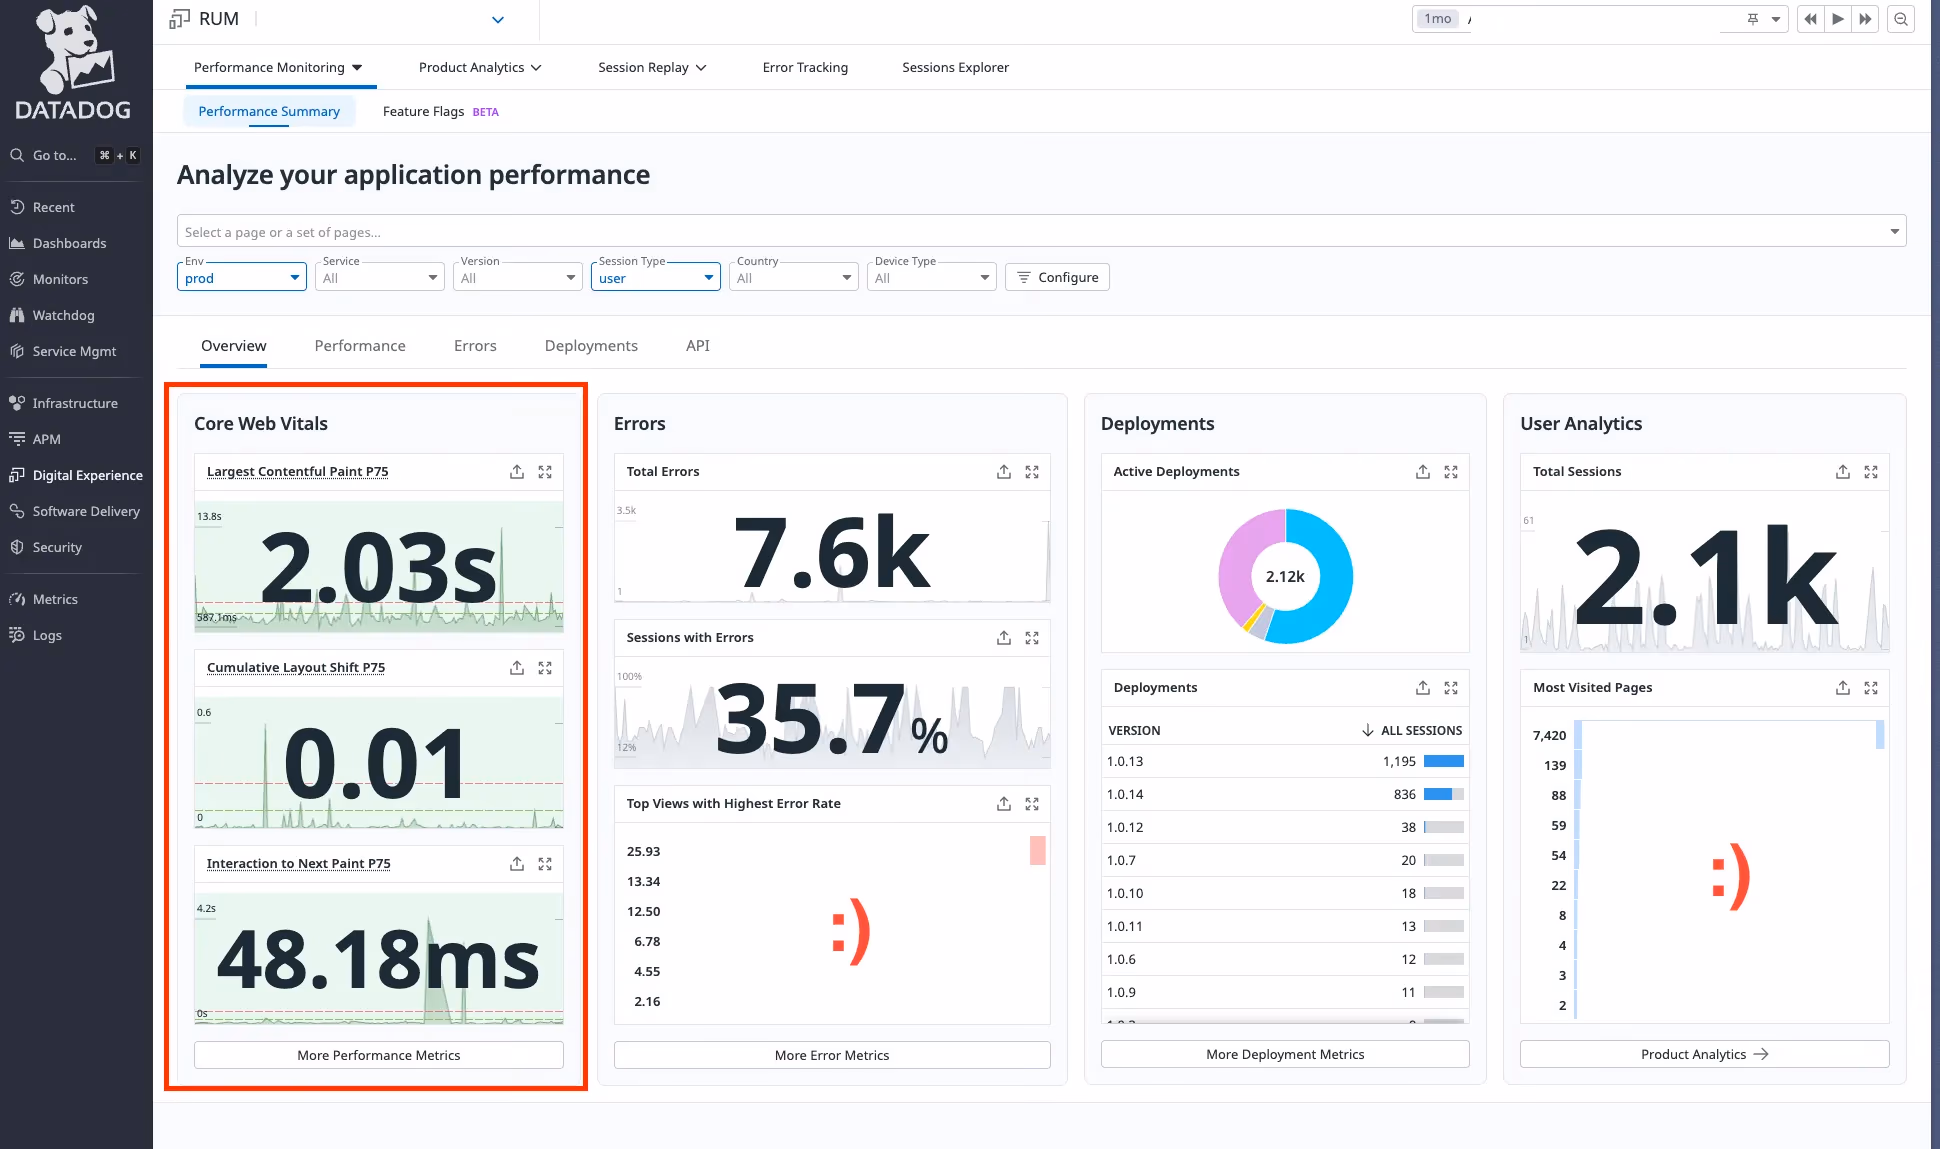
Performance Summary - Overview
In this section you basically see an overview of your application's performance metrics: CWV scores, error count, deployed versions of your application, amount of sessions, and most visited URLs of your application.
Performance Summary - Performance
This panel provides CWV measurements for your selected time span. I also like the section that shows your application's URLs and their CWV values, allowing you to easily see which parts of your application have slower loading times.
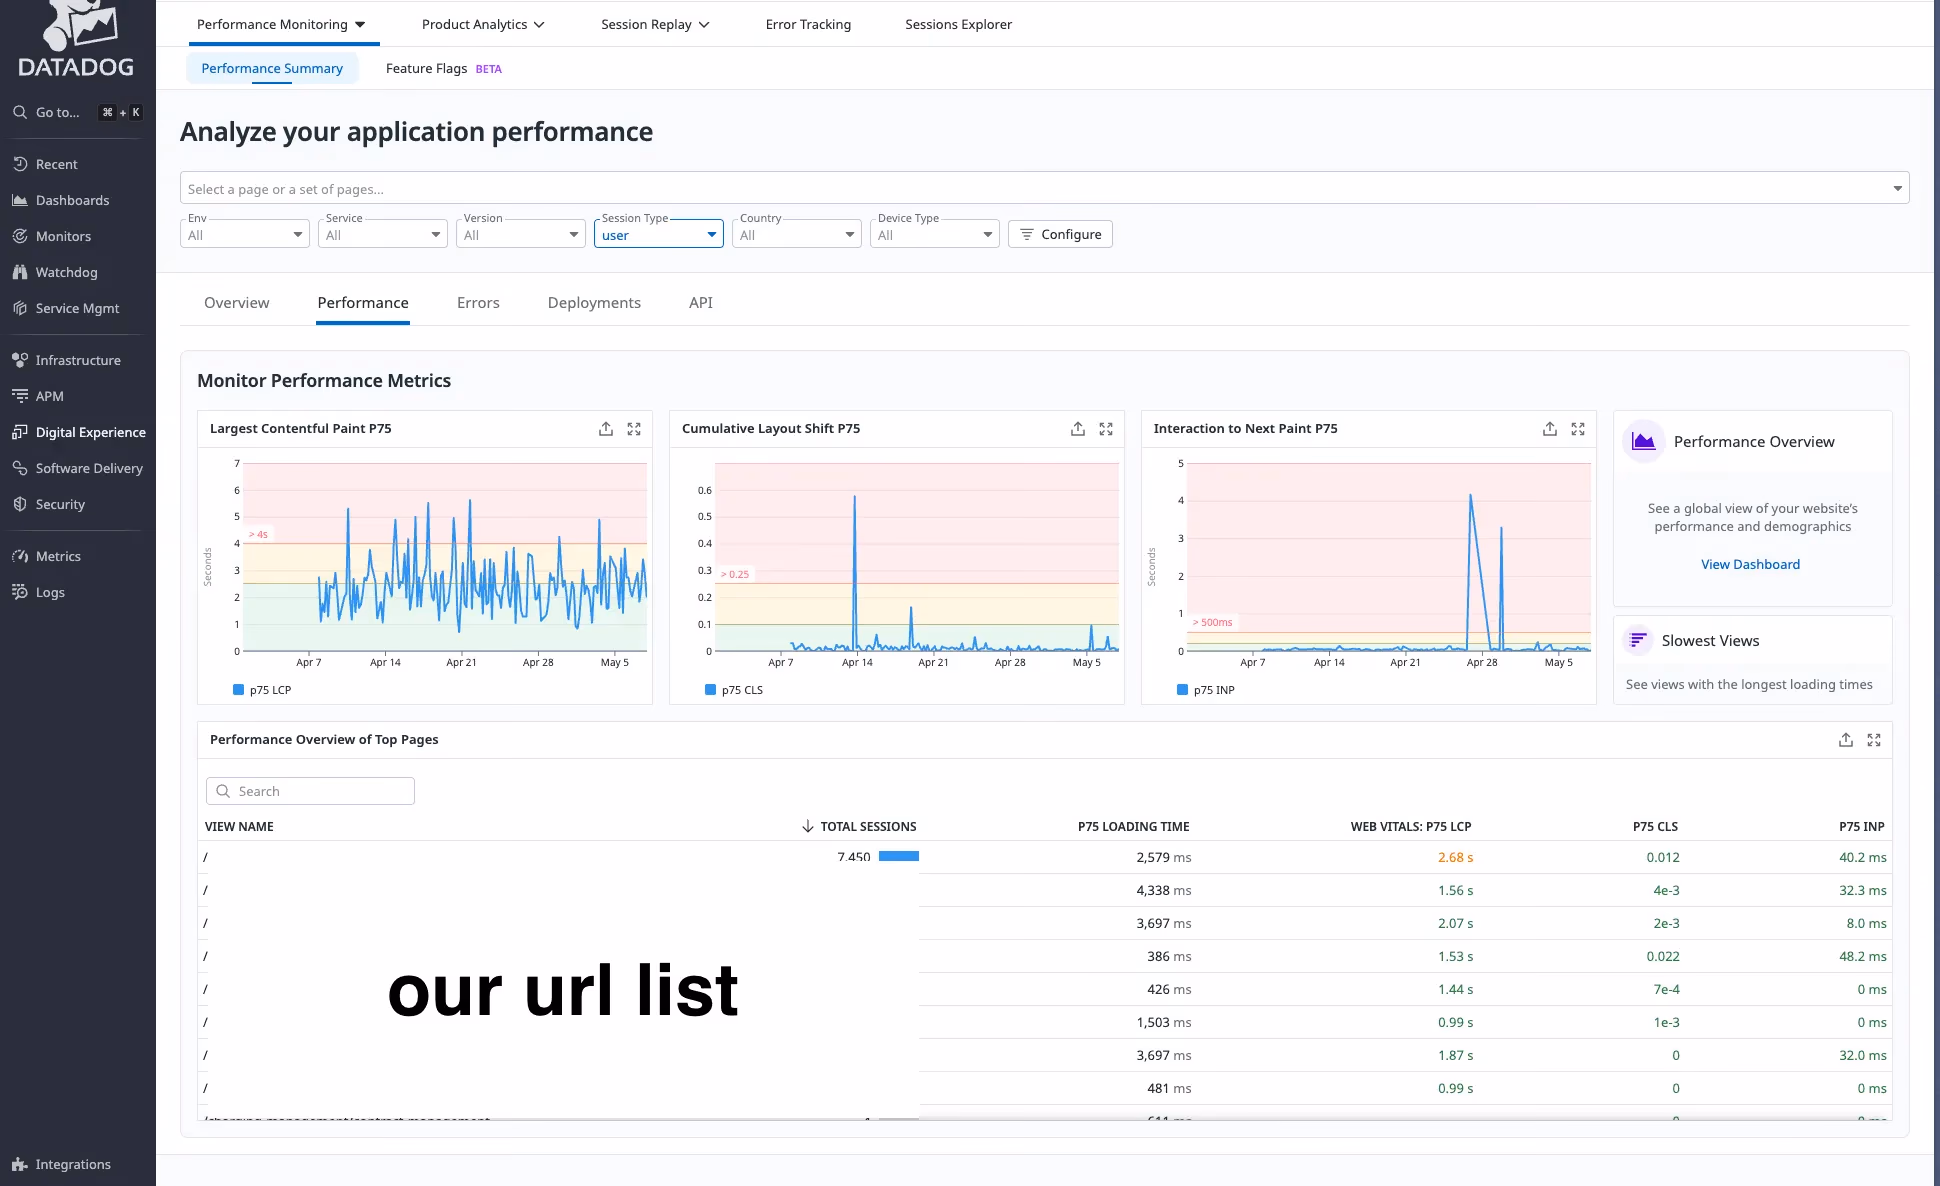
If you want a more detailed performance analysis, you can click on "View Dashboard" (under the Monitor Performance Metrics section), which will greet you with a very dense dashboard.
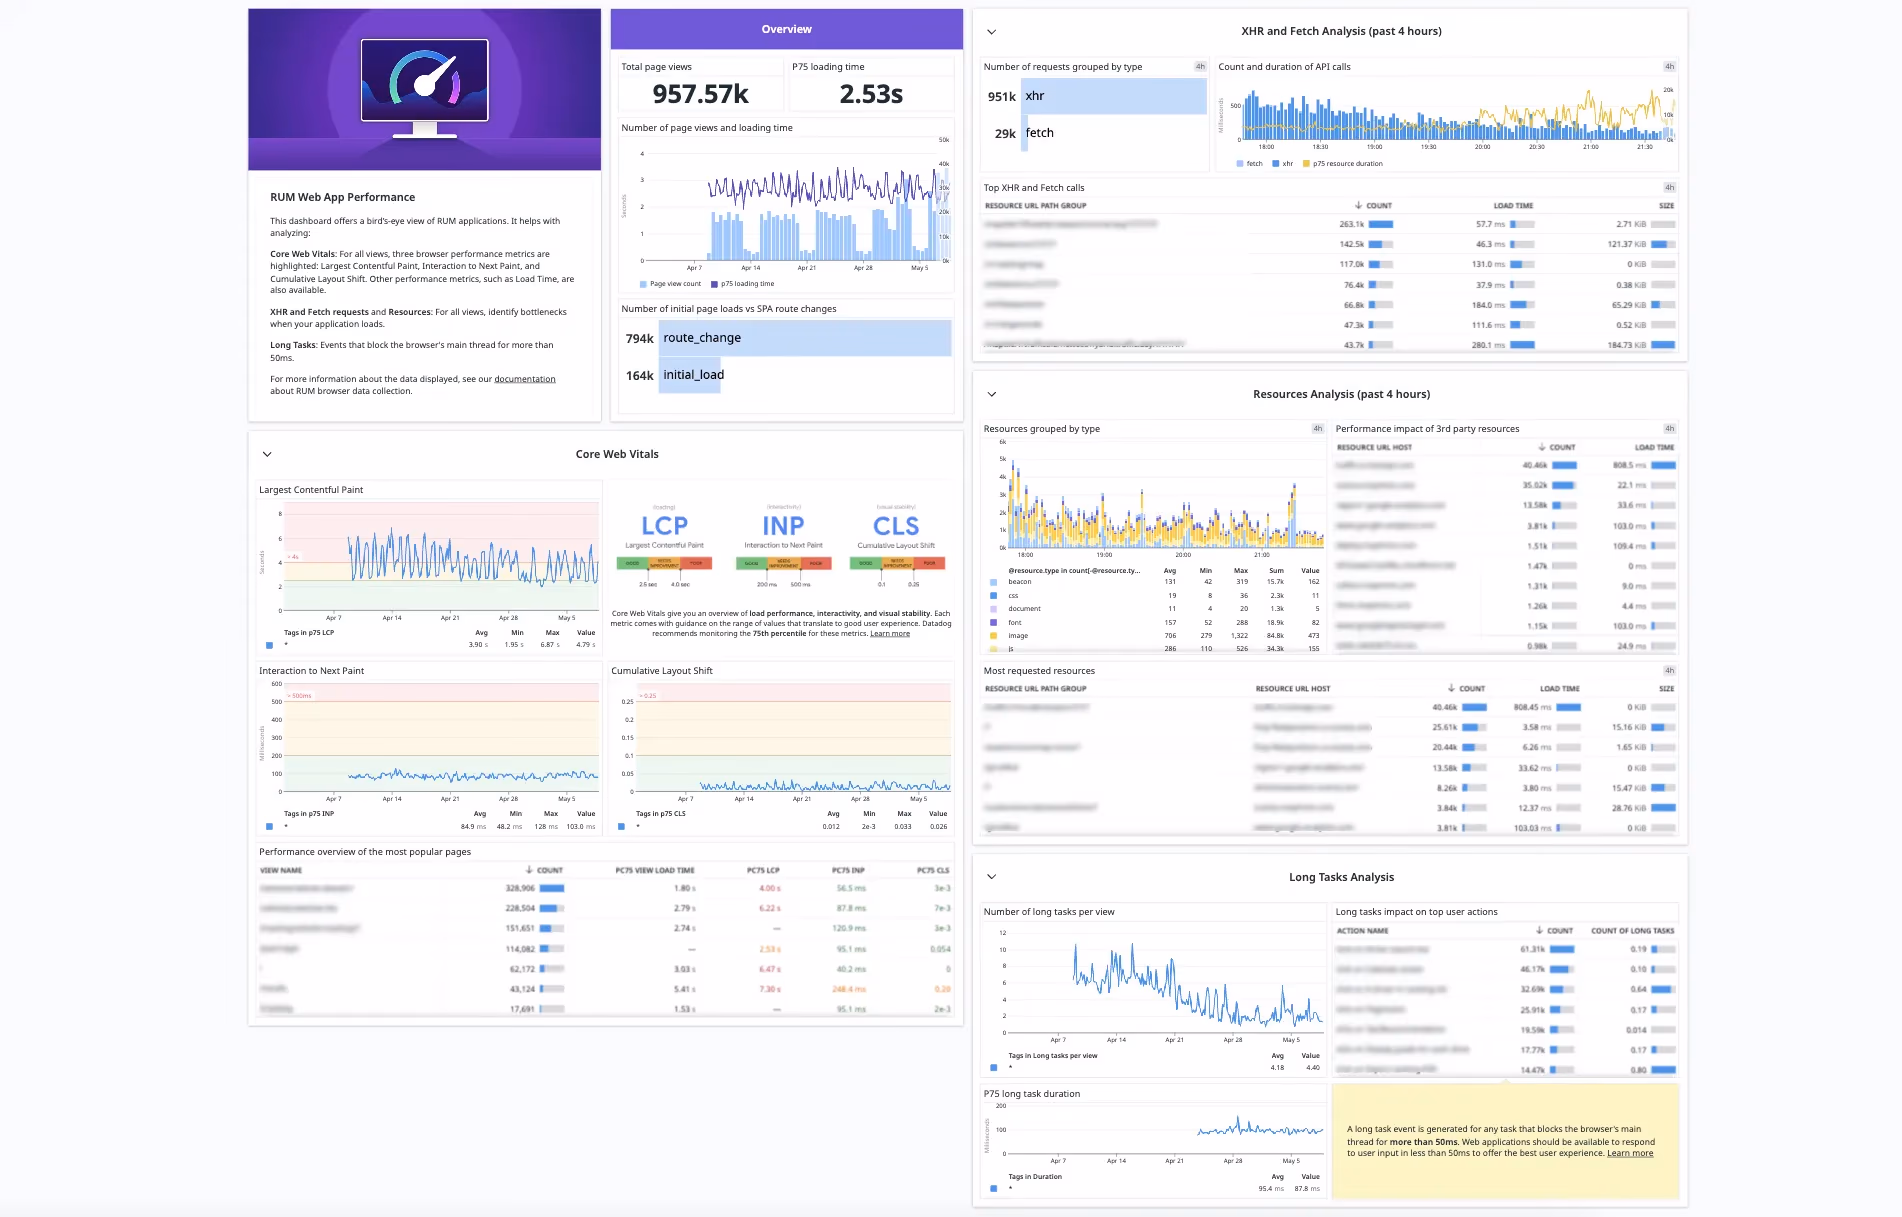
Here you have more information than just CWV:
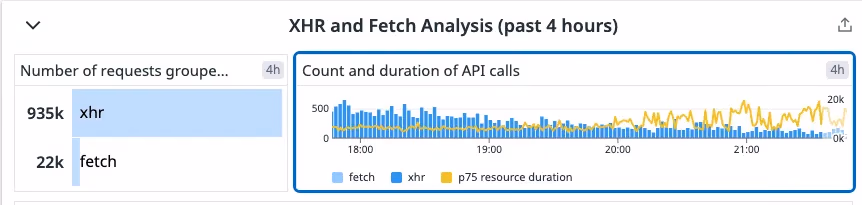
XHR and Fetch Analysis
Here, you can see the number of requests made from users' browsers, their load times, and sizes.
Resources Analysis
Shows what resources have been transferred to users' browsers (CSS, font files, JS, images, etc.).
Performance Impact of 3rd Party Resources
This is quite useful if you use any third-party resources (like feedback forms, other analytics tools like Google Analytics, etc.). You can see their load times and understand how they impact your web page's performance.
Performance Overview of the Most Popular Pages
For each page in your application, you can see individual CWV scores and load time metrics. This allows you to easily identify your worst-performing page.
Long Tasks Analysis
This is great for keeping track of how responsive your app is. If your application blocks the main thread for any task longer than 50ms, it is marked as a long task, and in this section, you can easily track them.
Session Replay
Session replay is where you can start collaborating with your UX team. This feature basically captures changes made in the DOM and user actions (such as clicks, mouse movements, and scrolling). Then in Datadog, it reconstructs these events and presents them to you in a video player-like format.
At first glance, it looks like session replay is a video recording of what the user is doing in your application, but it is not a video recording at all. It is just mimicking the DOM and mouse events, reconstructing them in Datadog, and playing it for you.
Funnel Analysis
This is a tool for tracking conversion rates. For example, in our application, we wanted to know how many sessions visited our signup page and how many sessions successfully signed up.
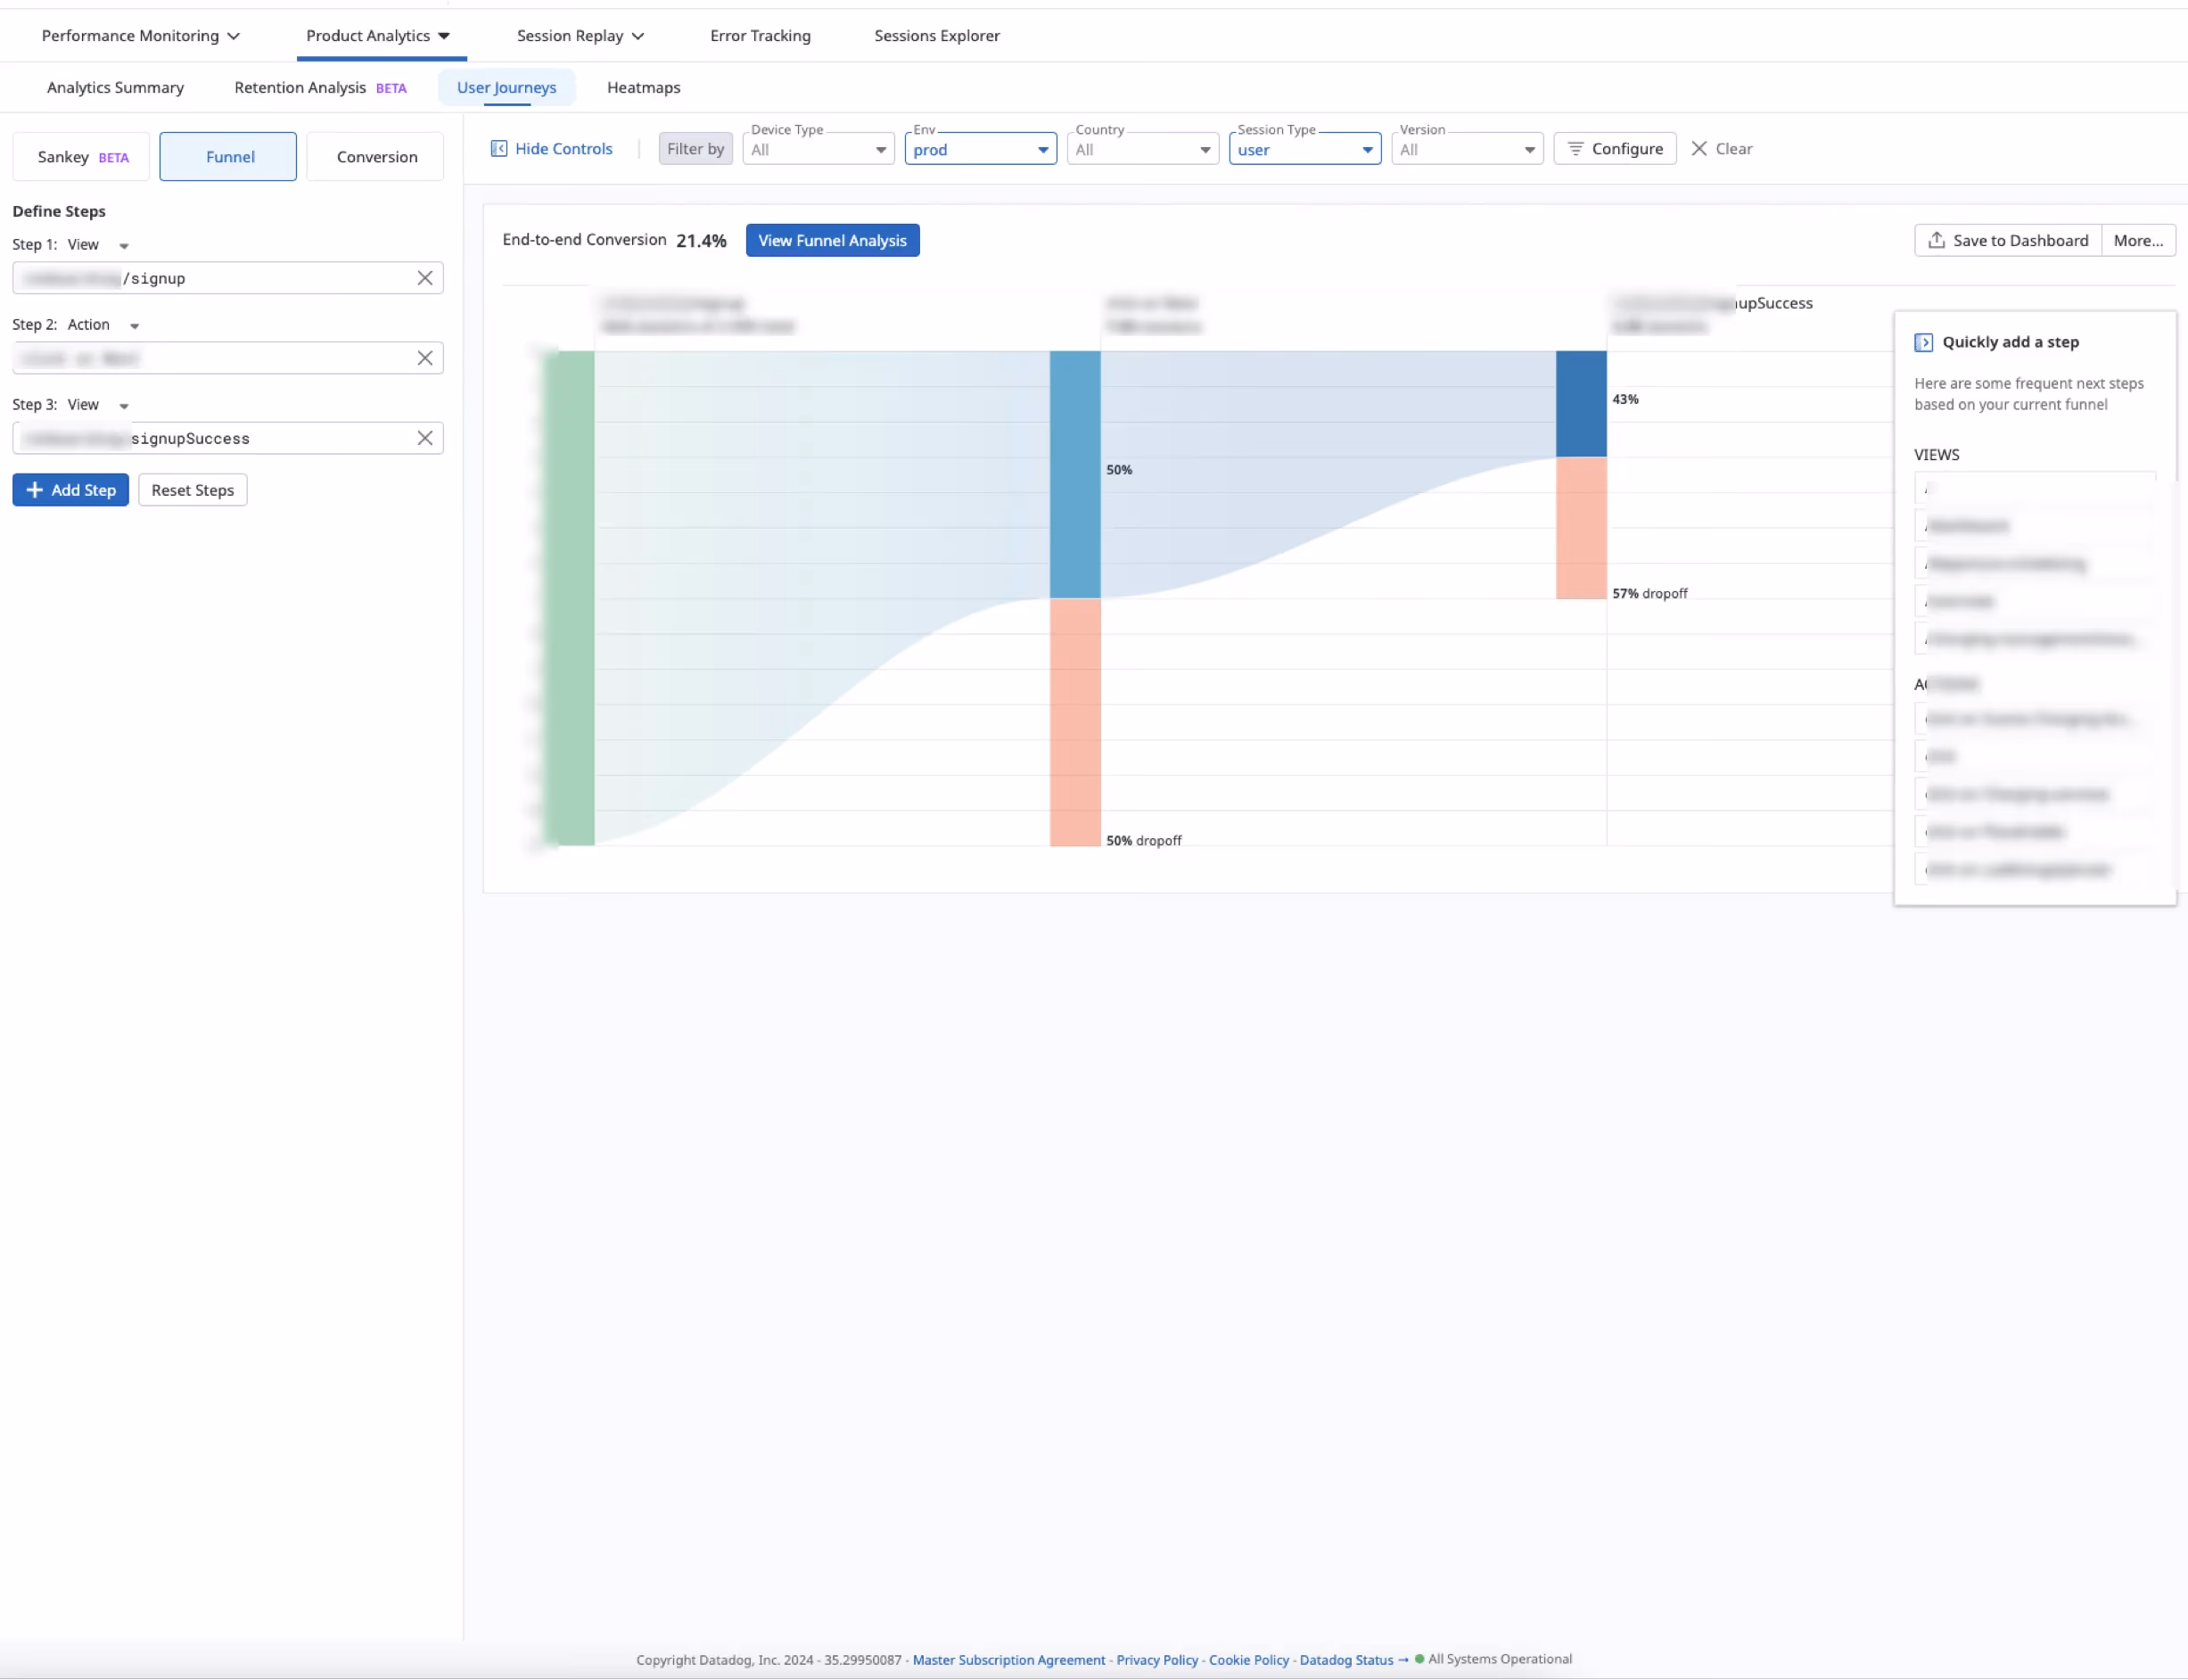
In this example, we visualize how many actual page visits ended up with a customer signup.
Heatmaps
Heatmap is a summary of user interactions captured during session replays. It has 3 main sections:
- Click maps: View user interactions (clicks) to understand how users engage with your page
- Top Elements: View a ranking of up to the top 10 most interacted-with elements on a given page
- Scroll maps: View how far users scroll down a page, including where the average fold of a page falls
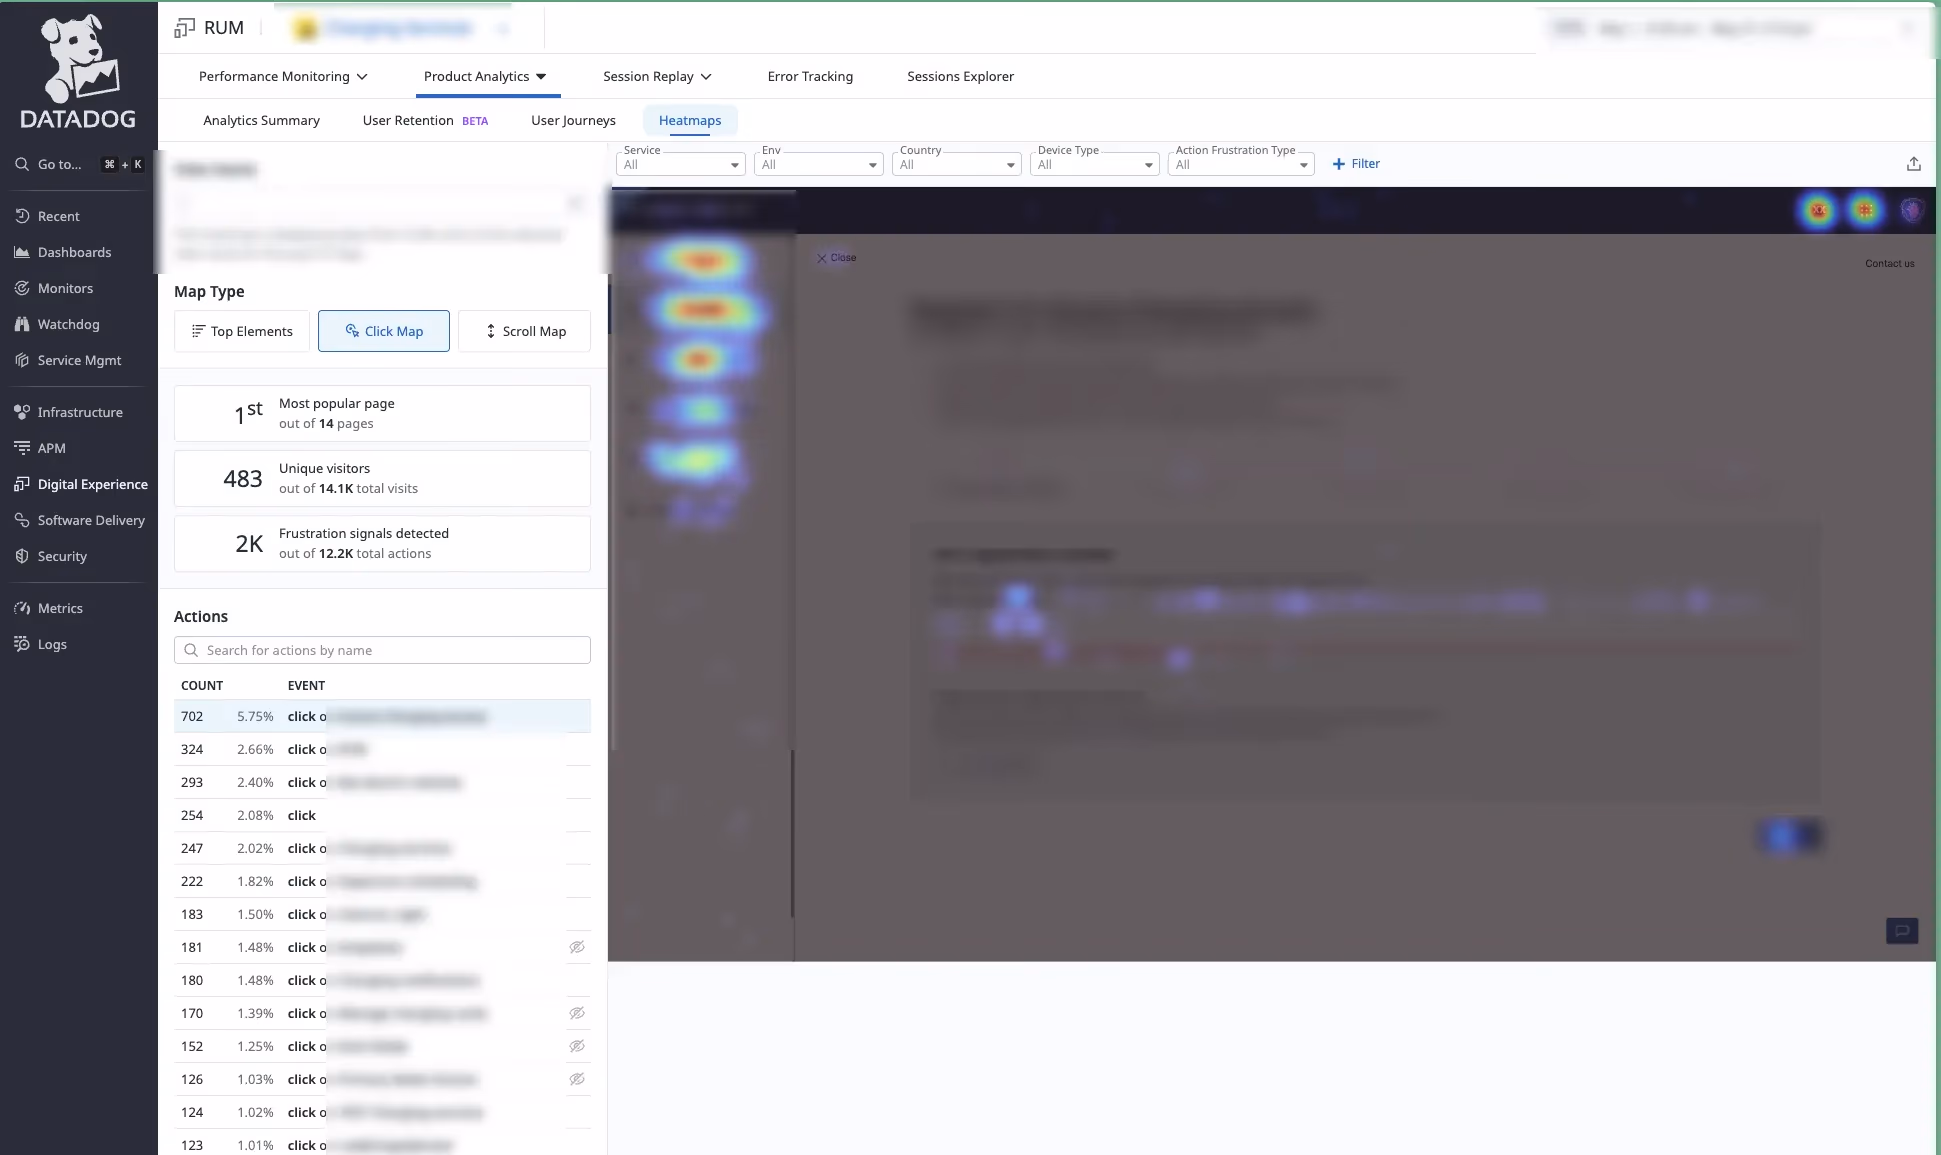
Click Map
Here you can see where the most clicks happen on each page of your application. It's a great way to visualize and validate if certain features are being used or discovered by your users.
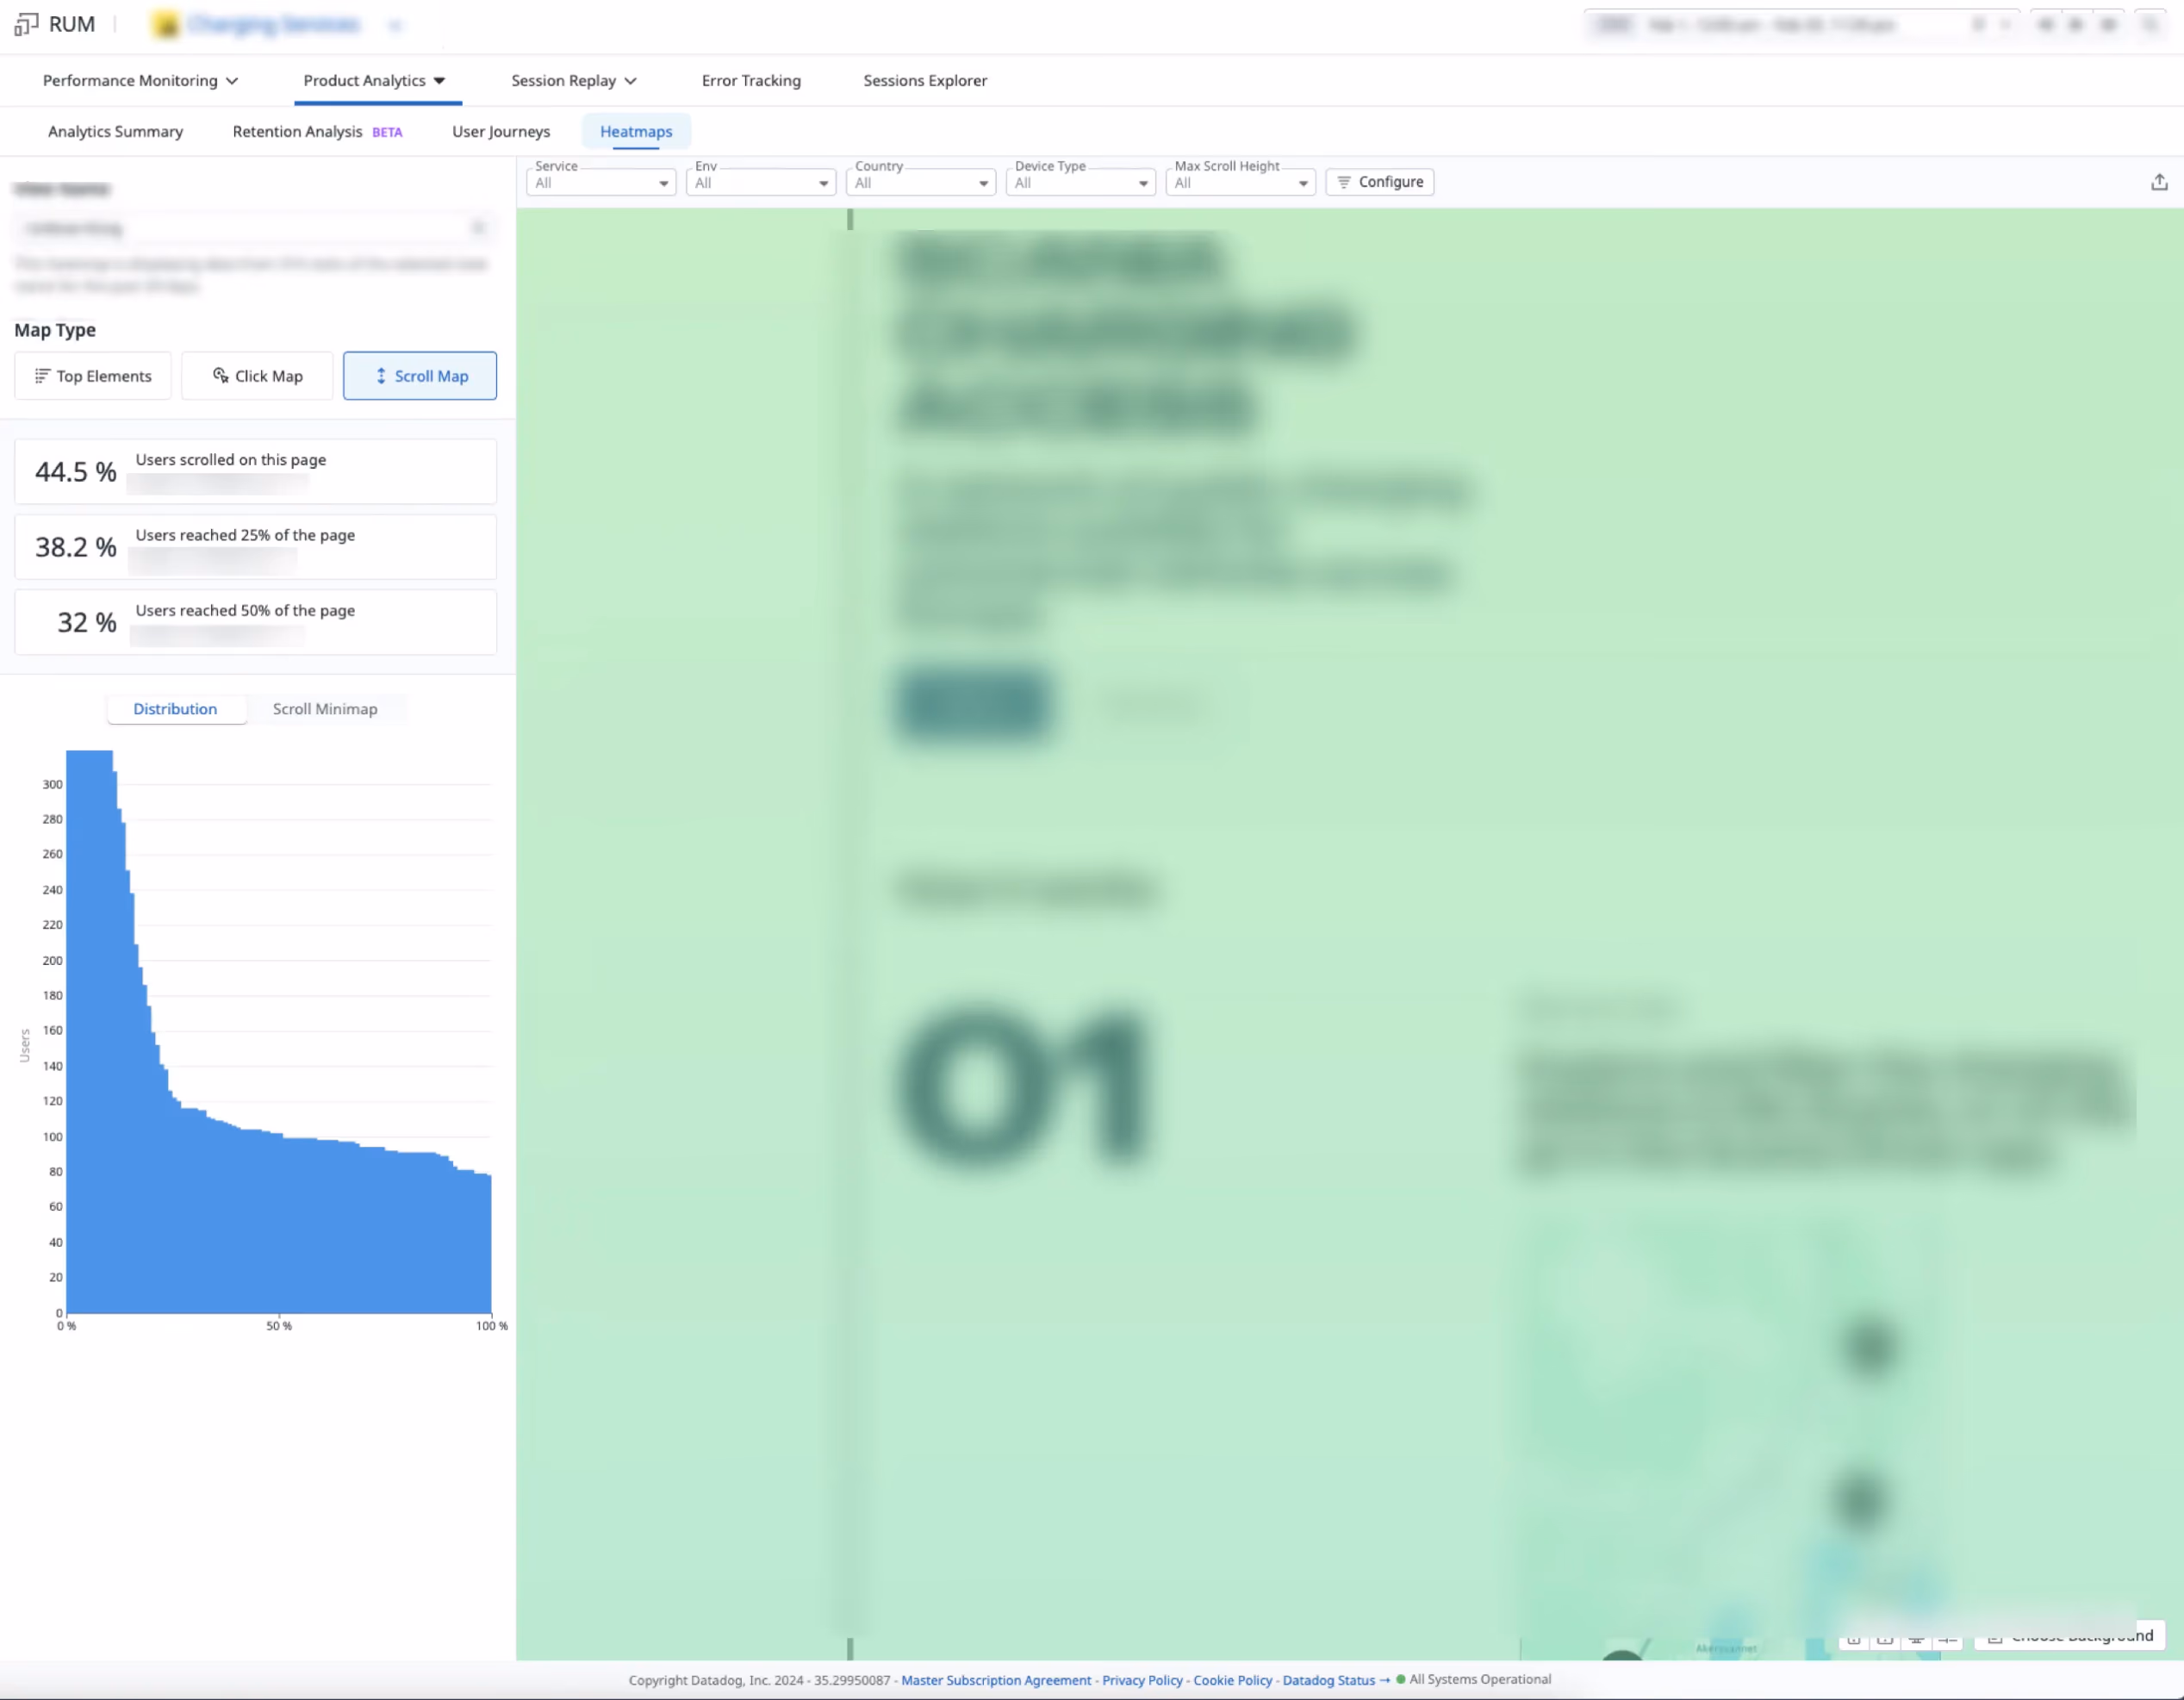
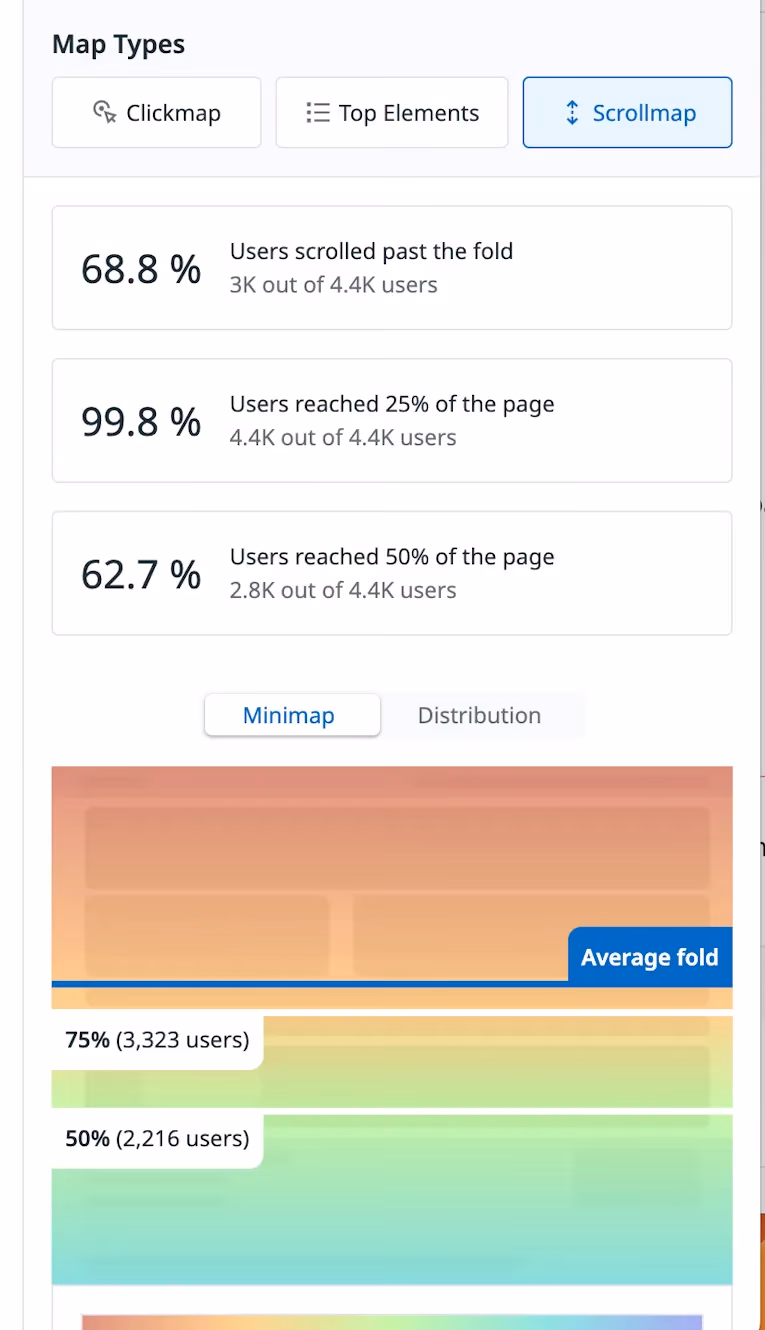
Scroll Maps
Scrollmaps visualize the scrolling behavior of your users for the selected page. They also show the average fold, which means how much of the page is visible to users on average before they start scrolling.
Additionally, it provides a distribution of scrolling behavior, allowing you to track whether users are actually scrolling all the way down to your content. This helps you determine if your content is too long for most users' viewports.
Deployment Tracking
Each time you introduce new features or make changes to your web app, it is a good practice to update your app's version information accordingly.
You can easily track deployed versions of your application in this panel. It is quite useful for monitoring error rates and performance metrics. In case of unexpected performance problems or increased error logs, you can see when these issues started to happen and keep track of them.
It is up to you how you want to tag your application version. If you want to be surgically accurate, you can also tag your app with the related Git commit hash, allowing you to pinpoint exactly when something unexpected happens. This makes it easy to find the code changes causing issues in your Git repository.
[Image: Bergianska trädgården, Stockholm - photo by me]
Conclusion
And that's it! This is my version of an introduction to RUM 101. Until now, we haven't done anything ourselves, and all of the features I mentioned above are out-of-the-box features of Datadog RUM when you implement it. Isn't that cool?
In my upcoming blog posts, I would like to dig a little bit deeper and explore more capabilities of Datadog RUM. If you are willing to customize things more yourself, Datadog RUM becomes even more powerful, allowing you to do mind-blowing things and impress your team. :)
I would appreciate any feedback you think I should consider to improve my blog posts.